question

Javier Benitez avatar image
0 Likes"
Javier Benitez asked Javier Benitez commented

How can I track the utilization of operators on different intervals of time?

Since I have a lot of variation in the process times, I would like to track the utilization of the operators based on interval times, could be every hour, could be every 6 hours, and I want to have the registry of the utilization only that time in the graphic and then after the interval reset the tracked utilization, so I dont take the whole average utilization in the equation.

FlexSim 19.1.2
statistic collectorutilizationdasbhoard
· 2
5 |100000

Up to 12 attachments (including images) can be used with a maximum of 23.8 MiB each and 47.7 MiB total.

tannerp avatar image tannerp commented ·

Hi @Javier Benitez,

Do you know what the time intervals will be? If so, I would create a Time Table that will force the Operators to be "Off Shift" at times when they're not supposed to be utilized. That way, you can cut out the "Off Shift" times and get the averages you need. Let me know if you'd like more information about this.

0 Likes 0 ·
Javier Benitez avatar image Javier Benitez tannerp commented ·

Well for the intervals I would like to change it based on different analysis.

I dont think that creating a timetable would be a solution, I do have one currently that makes the operator scheduled down when they dont suppose to be working.

What I meant by removing the whole average of utilization from the equation, is that I would like to analyze some intervals of time that doesnt get affected by the total tracked utilization, that way I could see some peaks of utilization in a isolated way.

0 Likes 0 ·

1 Answer

·
Jordan Johnson avatar image
1 Like"
Jordan Johnson answered Javier Benitez commented

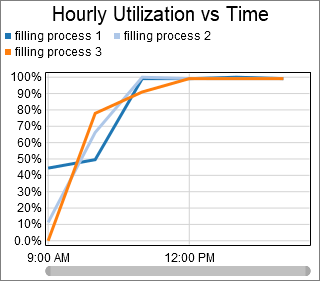
Here is a model with the chart you want:

final-tng-2-modified-2.fsm

To make this model, I added a section to the State process flow:

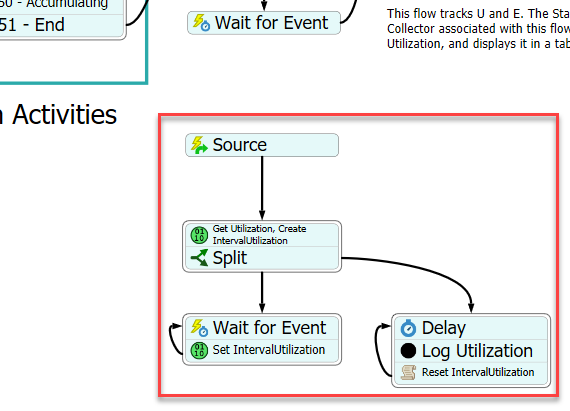
The unmodified flow makes a tracked variable called Utilization that tracks utilization of each object. The idea of the modified flow is to make a second token that also has a tracked variable for utilization. It just does everything the original Utilization tracked variable does, except that it gets reset every hour. This causes it to "forget" any time previous. The time in the Delay controls how often the value is reset.

Then I made a Statistics Collector that adds a row for every token that crosses the Log Utilization activity. The values are recorded in the table, and then reset.

Then I made a chart that looks at the Statistics Collector. Hopefully that all makes sense.


· 3
5 |100000

Up to 12 attachments (including images) can be used with a maximum of 23.8 MiB each and 47.7 MiB total.

Javier Benitez avatar image Javier Benitez commented ·

Yes! Perfect, this was what I was looking for, appreciate you help.

Just one more thing, how can I modify the Statistic collector to only track the time that is not on Scheduled down? Because, makes the graphic harder to read that way.
dashboardtimevsutilization.png

0 Likes 0 ·
Jordan Johnson avatar image Jordan Johnson ♦♦ Javier Benitez commented ·

The time plot doesn't have a way to hide gaps in time like that. If you want a chart that doesn't have gaps, I would make another statistics collector that records the total amount of time outside of scheduled down. That can become your time column on the chart. Something like

Model.time - data.rowValue.stats.state().getTotalTimeAt(STATE_SCHEDULED_DOWN)
1 Like 1 ·
Javier Benitez avatar image Javier Benitez Jordan Johnson ♦♦ commented ·

Alright, will do so, thanks!

0 Likes 0 ·

Write an Answer

Hint: Notify or tag a user in this post by typing @username.

Up to 12 attachments (including images) can be used with a maximum of 23.8 MiB each and 47.7 MiB total.