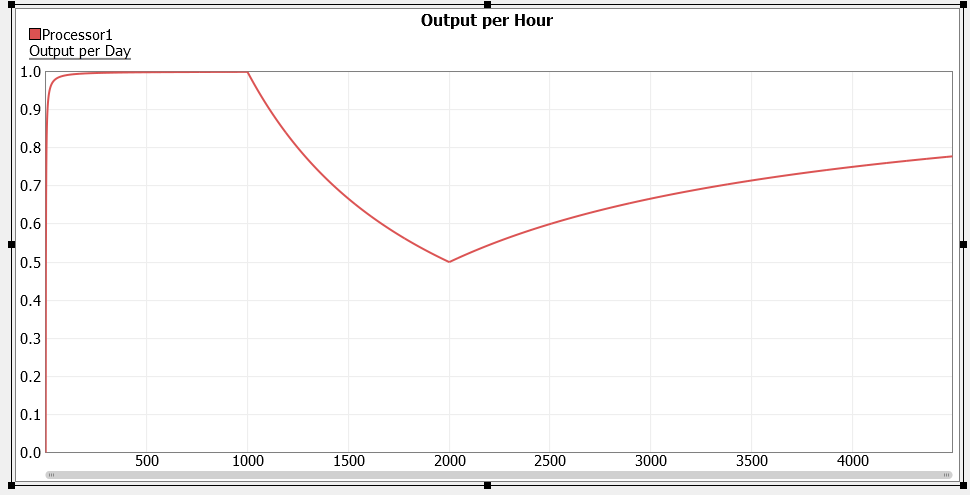
I'm trying to get current output per hour for processor not average output per hour.
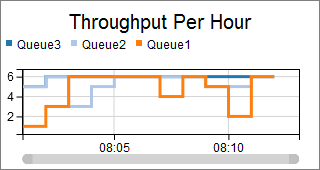
and this is what i get it should not be something like that it should be like a stairs output-per-hour.fsm
I'm trying to get current output per hour for processor not average output per hour.
and this is what i get it should not be something like that it should be like a stairs output-per-hour.fsm
You can get the output per hour from a tracked variable. You can set the value of the tracked variable by source code initiated by a message that you send delayed each hour. The difference of the current total output and the total output an hour ago is the value of the tracked variable.
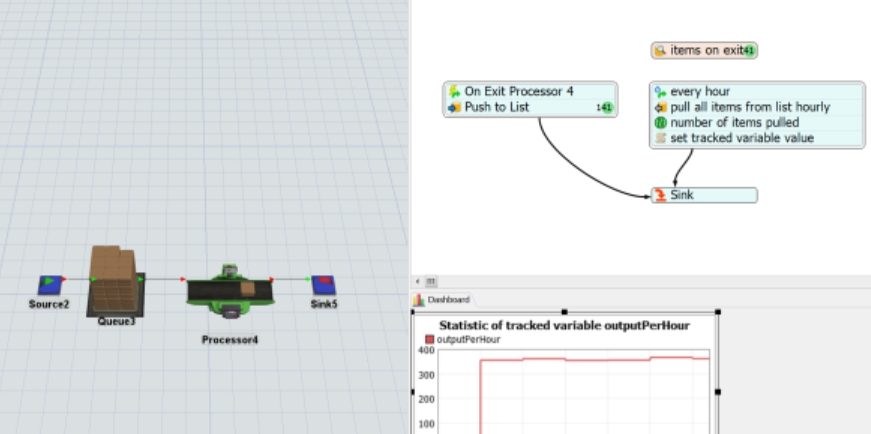
The attached model uses process flow to update the tracked variable instead. The items are pushed on a list. Then I pull all items every hour from the list. The pulled items are stored in an array. The size of the array is the value the tracked variable get. The tracked variable has got statistics which I can place as charts in dashboards.
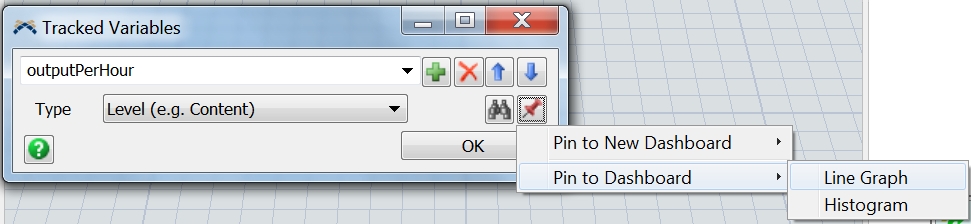
tracked variable"outPerHour" properties used to pin the statistic to a dashboard
substitute-out-per-hour-process-flow-jv.fsm Flexsim 16.0.3
In version 2016, I don't know how to make that chart. If you upgrade to version 2018, here are some instructions you can follow:
In the Dashboard Library, you can use the Throughput Per Hour template:
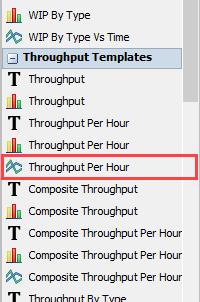
Using this template, you can get the throughput per hour graph you are looking for. This one is per minute, but that is easy to change. I also changed the line style to stair-step:
9 People are following this question.
FlexSim can help you understand and improve any system or process. Transform your existing data into accurate predictions.
FlexSim is a fully 3D simulation software environment. FlexSim can be used to simulate any process in any industry.
FlexSim®, FlexSim Healthcare™, Problem Solved.®, the FlexSim logo, the FlexSim X-mark, and the FlexSim Healthcare logo with stylized Caduceus mark are trademarks of FlexSim Software Products, Inc. All rights reserved.
May we collect and use your data?
Learn more about the Third Party Services we use and our Privacy Statement.May we collect and use your data to tailor your experience?
Explore the benefits of a customized experience by managing your privacy settings for this site or visit our Privacy Statement to learn more about your options.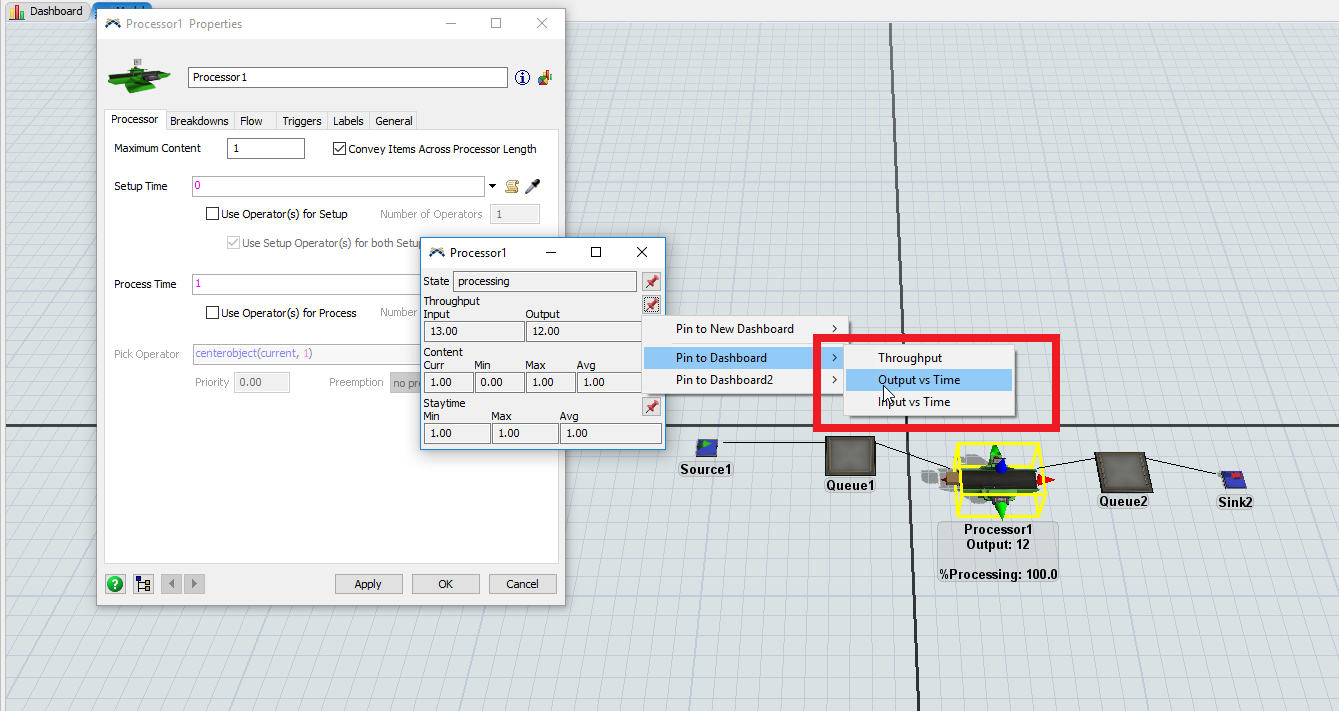
