question

Christopher S2 avatar image
0 Likes"
Christopher S2 asked Christopher S2 commented

How to calculate inter-arrival time at a conveyor decision point?

I feel like this is a simple question, but I am having difficulty solving it.

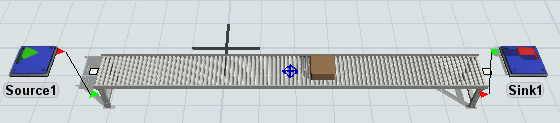
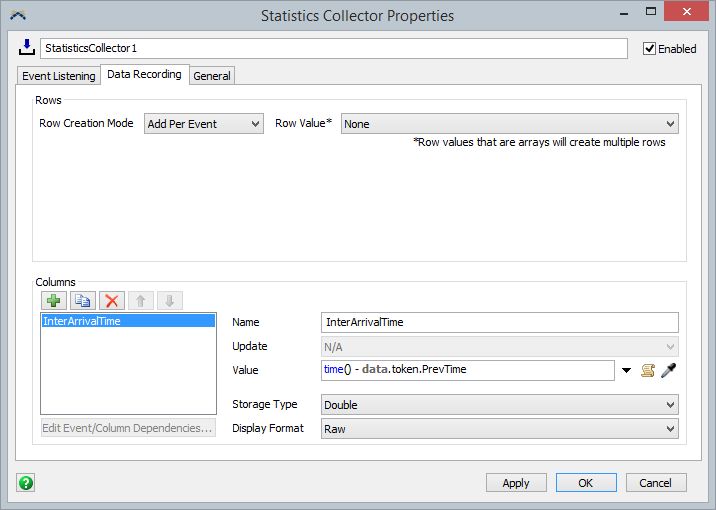
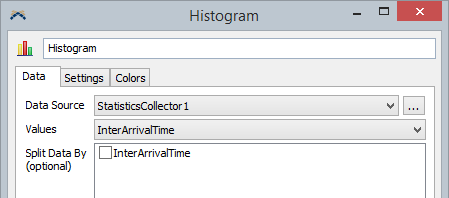
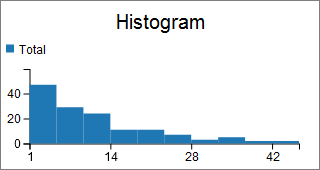
I have a power and free conveyor that has a set number of containers on it. They make a loop around the conveyor. I have a decision point on the conveyor, and I just want to detect the inter-arrival time between containers, in seconds, and display as a histogram. What statistic collector options do I need to use to do this? I tried to use intervals, but I can't figure out how to use the time from the last container. It tries to take the interval from the same container, resulting in a zero.
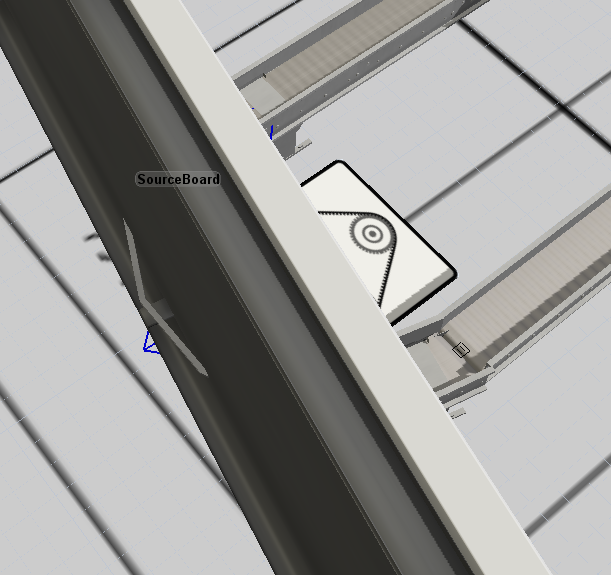
Decision Point:

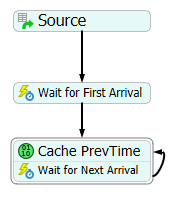
Container OnArrival, start timer:

Waiting for next container, timer counting:

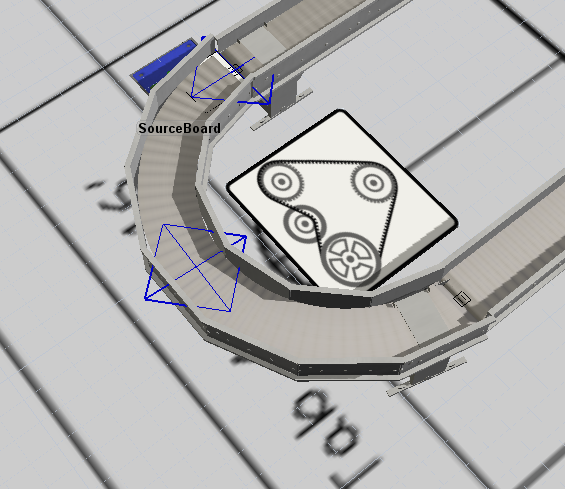
Next container OnArrival, stop counting on first timer, start new timer, display first timer result on histogram:

FlexSim 18.2.2
statistics collectorconveyor decision pointpower and free conveyor
1.png (191.2 KiB)
2.png (206.2 KiB)
1.png (191.2 KiB)
· 2
5 |100000

Up to 12 attachments (including images) can be used with a maximum of 23.8 MiB each and 47.7 MiB total.

1 Answer

Jordan Johnson avatar image
1 Like"
Jordan Johnson answered Christopher S2 commented

Here is a model that displays the histogram you want:

inter-arrival-histogram.fsm

The model is not too important, except that items flow past a decision point:

I made this model just as a demonstration, but the approach should work in your model as well.

First, I made a Process Flow, to help with statistics:

This token in this Process Flow listens to the Decision Point, and "remembers" the time of the previous item by storing the value on a label. Every time an item arrives, the token updates its label that stores the previous time.

But the previous time is only half the story. We still need to get the different between when two items arrive. This is where I used the Statistics Collector. I created the Statistics Collector, and I have it listen to the OnExit of the Wait for Next Arrival activity. When that event occurs, the simulation time will be the time of the next arrival, and the token will remember the time of the previous arrival. So the Row Mode is Add Per Event, because we want a new row every time the token exits the activity. The column subtracts the previous time from the current time, which is the inter-arrival time:

This Statistics Collector produces a list of inter-arrival times, which is perfect for a histogram. Here are the settings for the histogram:

And that should produce a histogram:


· 1
5 |100000

Up to 12 attachments (including images) can be used with a maximum of 23.8 MiB each and 47.7 MiB total.