question

ShabDz avatar image
0 Likes"
ShabDz asked ShabDz commented

How to customize a graph to get expected volume in real time?

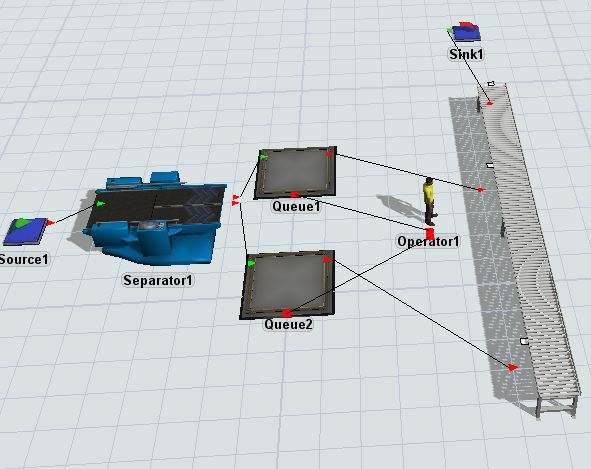
Hi, In the attached model Source1 generates batch of boxes (batch size=VOL) based on an schedule. I want to make a graph (line chart or histogram works well) to show how much of the total expected boxes have not left the Queues at each point of time.

Any help is appreciated.

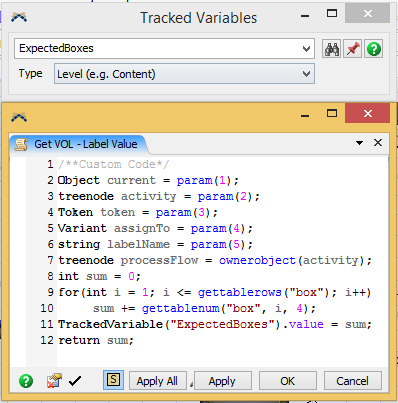
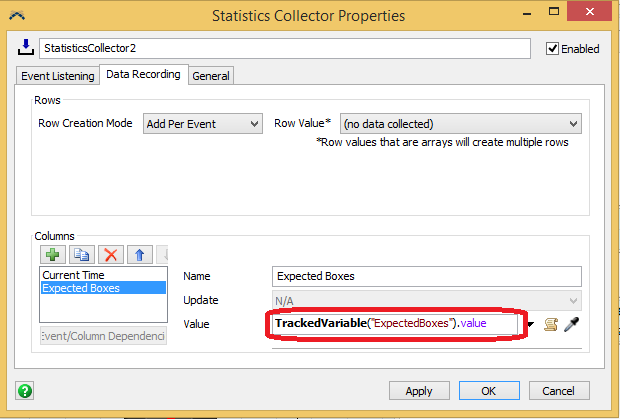
Note: "box" table reflects the arrival schedule and will be updated later for different scenarios. so I need to calculate the total expected volume for the graph using the following code:

  1. int sum = 0;
  2. for(int i = 1; i <= gettablerows("box"); i++)
  3. sum += gettablenum("box", i, 4);
  4. return sum;

test-dashboard.fsm

FlexSim 18.2.2
global tabledashboardsgraphs
capture.jpg (51.2 KiB)
test-dashboard.fsm (37.5 KiB)
5 |100000

Up to 12 attachments (including images) can be used with a maximum of 23.8 MiB each and 47.7 MiB total.

1 Answer

Raja Sekaran avatar image
1 Like"
Raja Sekaran answered ShabDz commented

@ShabDz

I have attached the model with changes. I have used process flow to count the number of expected boxes not released from the queue, then using a statistics collector tool to collect the data and then display it using the time plot dashboard.

Hope this helps.

Thanks.

support-dashboard.fsm


· 4
5 |100000

Up to 12 attachments (including images) can be used with a maximum of 23.8 MiB each and 47.7 MiB total.