Hello My Friends, I have a short question. Which of dashboard should I use to receive to average time, from source to sink by item type.
Thank You, Sylwia
Hello My Friends, I have a short question. Which of dashboard should I use to receive to average time, from source to sink by item type.
Thank You, Sylwia
The option Raja Sekaran mentioned is only available in versions 18+. To make this work in version 16 you can take a look at this model. Since there are big changes between versions its very helpful if you specify which version you are using in the options given when creating a question.
You can use Staytime By Type dashboard to capture the avg stay time between source and sink by itemtype. I have attached the model for reference. Hope this helps.
support-avgstaytime-dashboard.fsm
Thanks.
Thank You so much for answer. I've just download Your model but my flexsim (2016) doesn't see anything :(
Could You make a screen shot: Staytime by type, please? I suppose that's it what I am looking for.
Thank You so much,
Sylwia
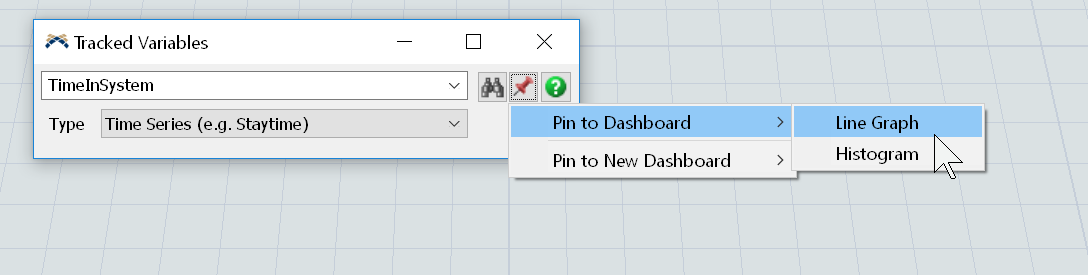
There's a tracked variable that exists within each model that will track that. The easiest way to get a chart of this tracked variable is to find it in your Toolbox, open the properties. and select the "push pin" icon in the corner of the properties window. It will give you the option to pin the variable statistics to either a line graph or a histogram chart.
12 People are following this question.
FlexSim can help you understand and improve any system or process. Transform your existing data into accurate predictions.
FlexSim is a fully 3D simulation software environment. FlexSim can be used to simulate any process in any industry.
FlexSim®, FlexSim Healthcare™, Problem Solved.®, the FlexSim logo, the FlexSim X-mark, and the FlexSim Healthcare logo with stylized Caduceus mark are trademarks of FlexSim Software Products, Inc. All rights reserved.