My model has multiple processors and multiprocessors. I have 11 operators workings in different shifts. How do I get the statistics for each operator. I want to monitor time an operators start and finish a task and I want to know what processor they worked at. I used Gantt chart but it will only display the states of operators. The gantt chart does not show what processors they were on.
You can use Process Flow and the Statistics Collector to create a table, which you can then use to create a chart:
operatorprocessorganttexample.fsm
There are a few steps to this process. First, you need to determine when an operator begins working with a processor, and when they stop. In the example model, the processors give task sequences to the operators, so you can listen for when the operators begin the utilize task the processor gives them, and when they finish that task. If you use Process Flow to give tasks to operators, you can listen to the OnEntry or OnExit of the task activities.
The next step is to create a Process Flow. This flow is just to help you gather the data that you need. It creates one token per operator in the Operators group. Then it listens for when the operator begins working with the processor, and also to when they stop. In this case, they listen to the OnStartTask and OnFinishTask events. If you use Process Flow to give tasks to operators, this process flow could listen to the OnEntry and OnExit of the correct task activities.
The next step is to create a Statistics Collector. This is probably the hardest part. You will notice that the statistics flow has two Start activities in it. I listen to those two start activities in the Statistics Collector, and configure the collector to create a new row every time a token enters the Log Task Begin (the first start activity), and to finish the row when the token enters the Log Task End activity. Each row records the operator, the processor, and the start and end times. The end time isn't set until the task is finished.
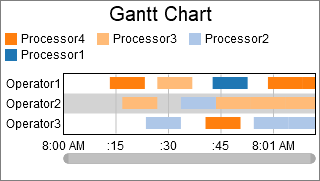
Once the Statistics Collector is created, you can make the chart you want.
14 People are following this question.
