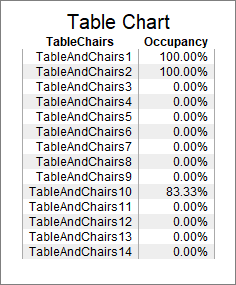
For example: A restaurant has 4 tables and each table has 4 chairs. 4 costumers arrive and each one sits at his own table. In this case the occupancy rate is of 25%.
Using the restaurant sample model, how can I display this data?
For example: A restaurant has 4 tables and each table has 4 chairs. 4 costumers arrive and each one sits at his own table. In this case the occupancy rate is of 25%.
Using the restaurant sample model, how can I display this data?
You can make a Statistics Collector to gather the data you want:

The basic idea of the Statistics Collector is that at time zero, you can add all the rows, one row for each TableAndChairs object in the group. You can then listen to all those objects' On Content Total Change event, and update the corresponding row.
Thanks for the help. Just one last question: How to display the occupansy of all the tables combined at the end of the simulation?
If you want a simple average, you can use a Calculated Table. You can select the OccupancyCollector as the Table. Then, add an "Aggregation of Column" metric. Set it to the AVG of Occupancy. On the Calculations tab, change the Update Mode to Always. Note that this average is not time-weighted.
What did you do to make appear in the object section:
You can sample Groups in the Toolbox from the Statistics Collector
14 People are following this question.
FlexSim can help you understand and improve any system or process. Transform your existing data into accurate predictions.
FlexSim is a fully 3D simulation software environment. FlexSim can be used to simulate any process in any industry.
FlexSim®, FlexSim Healthcare™, Problem Solved.®, the FlexSim logo, the FlexSim X-mark, and the FlexSim Healthcare logo with stylized Caduceus mark are trademarks of FlexSim Software Products, Inc. All rights reserved.
Privacy | Do not sell or share my personal information | Cookie preferences | Report noncompliance | Terms of use | Legal | © Autodesk Inc. All rights reserved