question

Azra S2 avatar image
0 Likes"
Azra S2 asked Azra S2 commented

Statistics pins, graph and "split data by", no options available

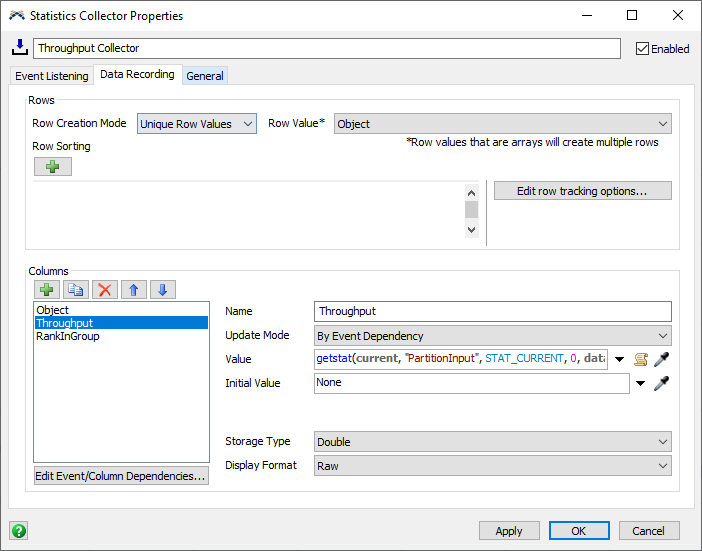
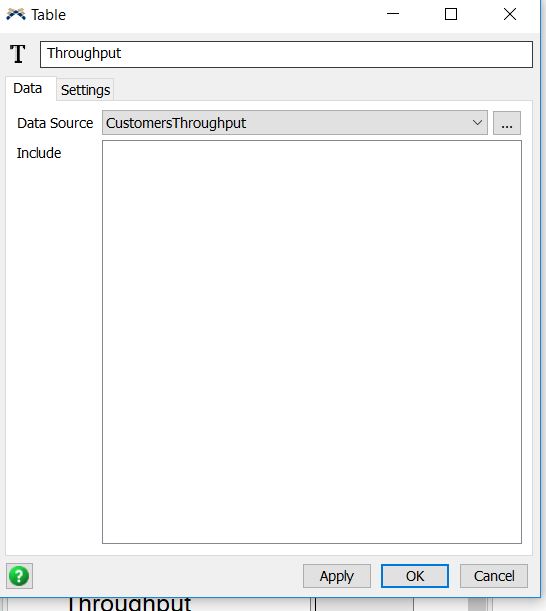
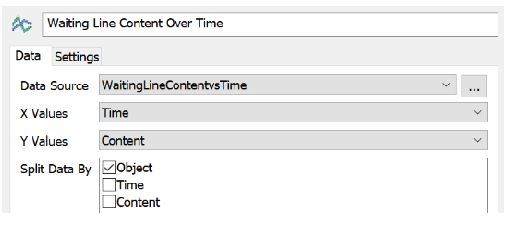
Hi, I am having this issue where my bar title and bar value fields are greyed and I cannot select the drop-down arrow. Similarly, under the include tab the options, "object", "max", "min", "average" cannot be seen. See image capture3 attached.

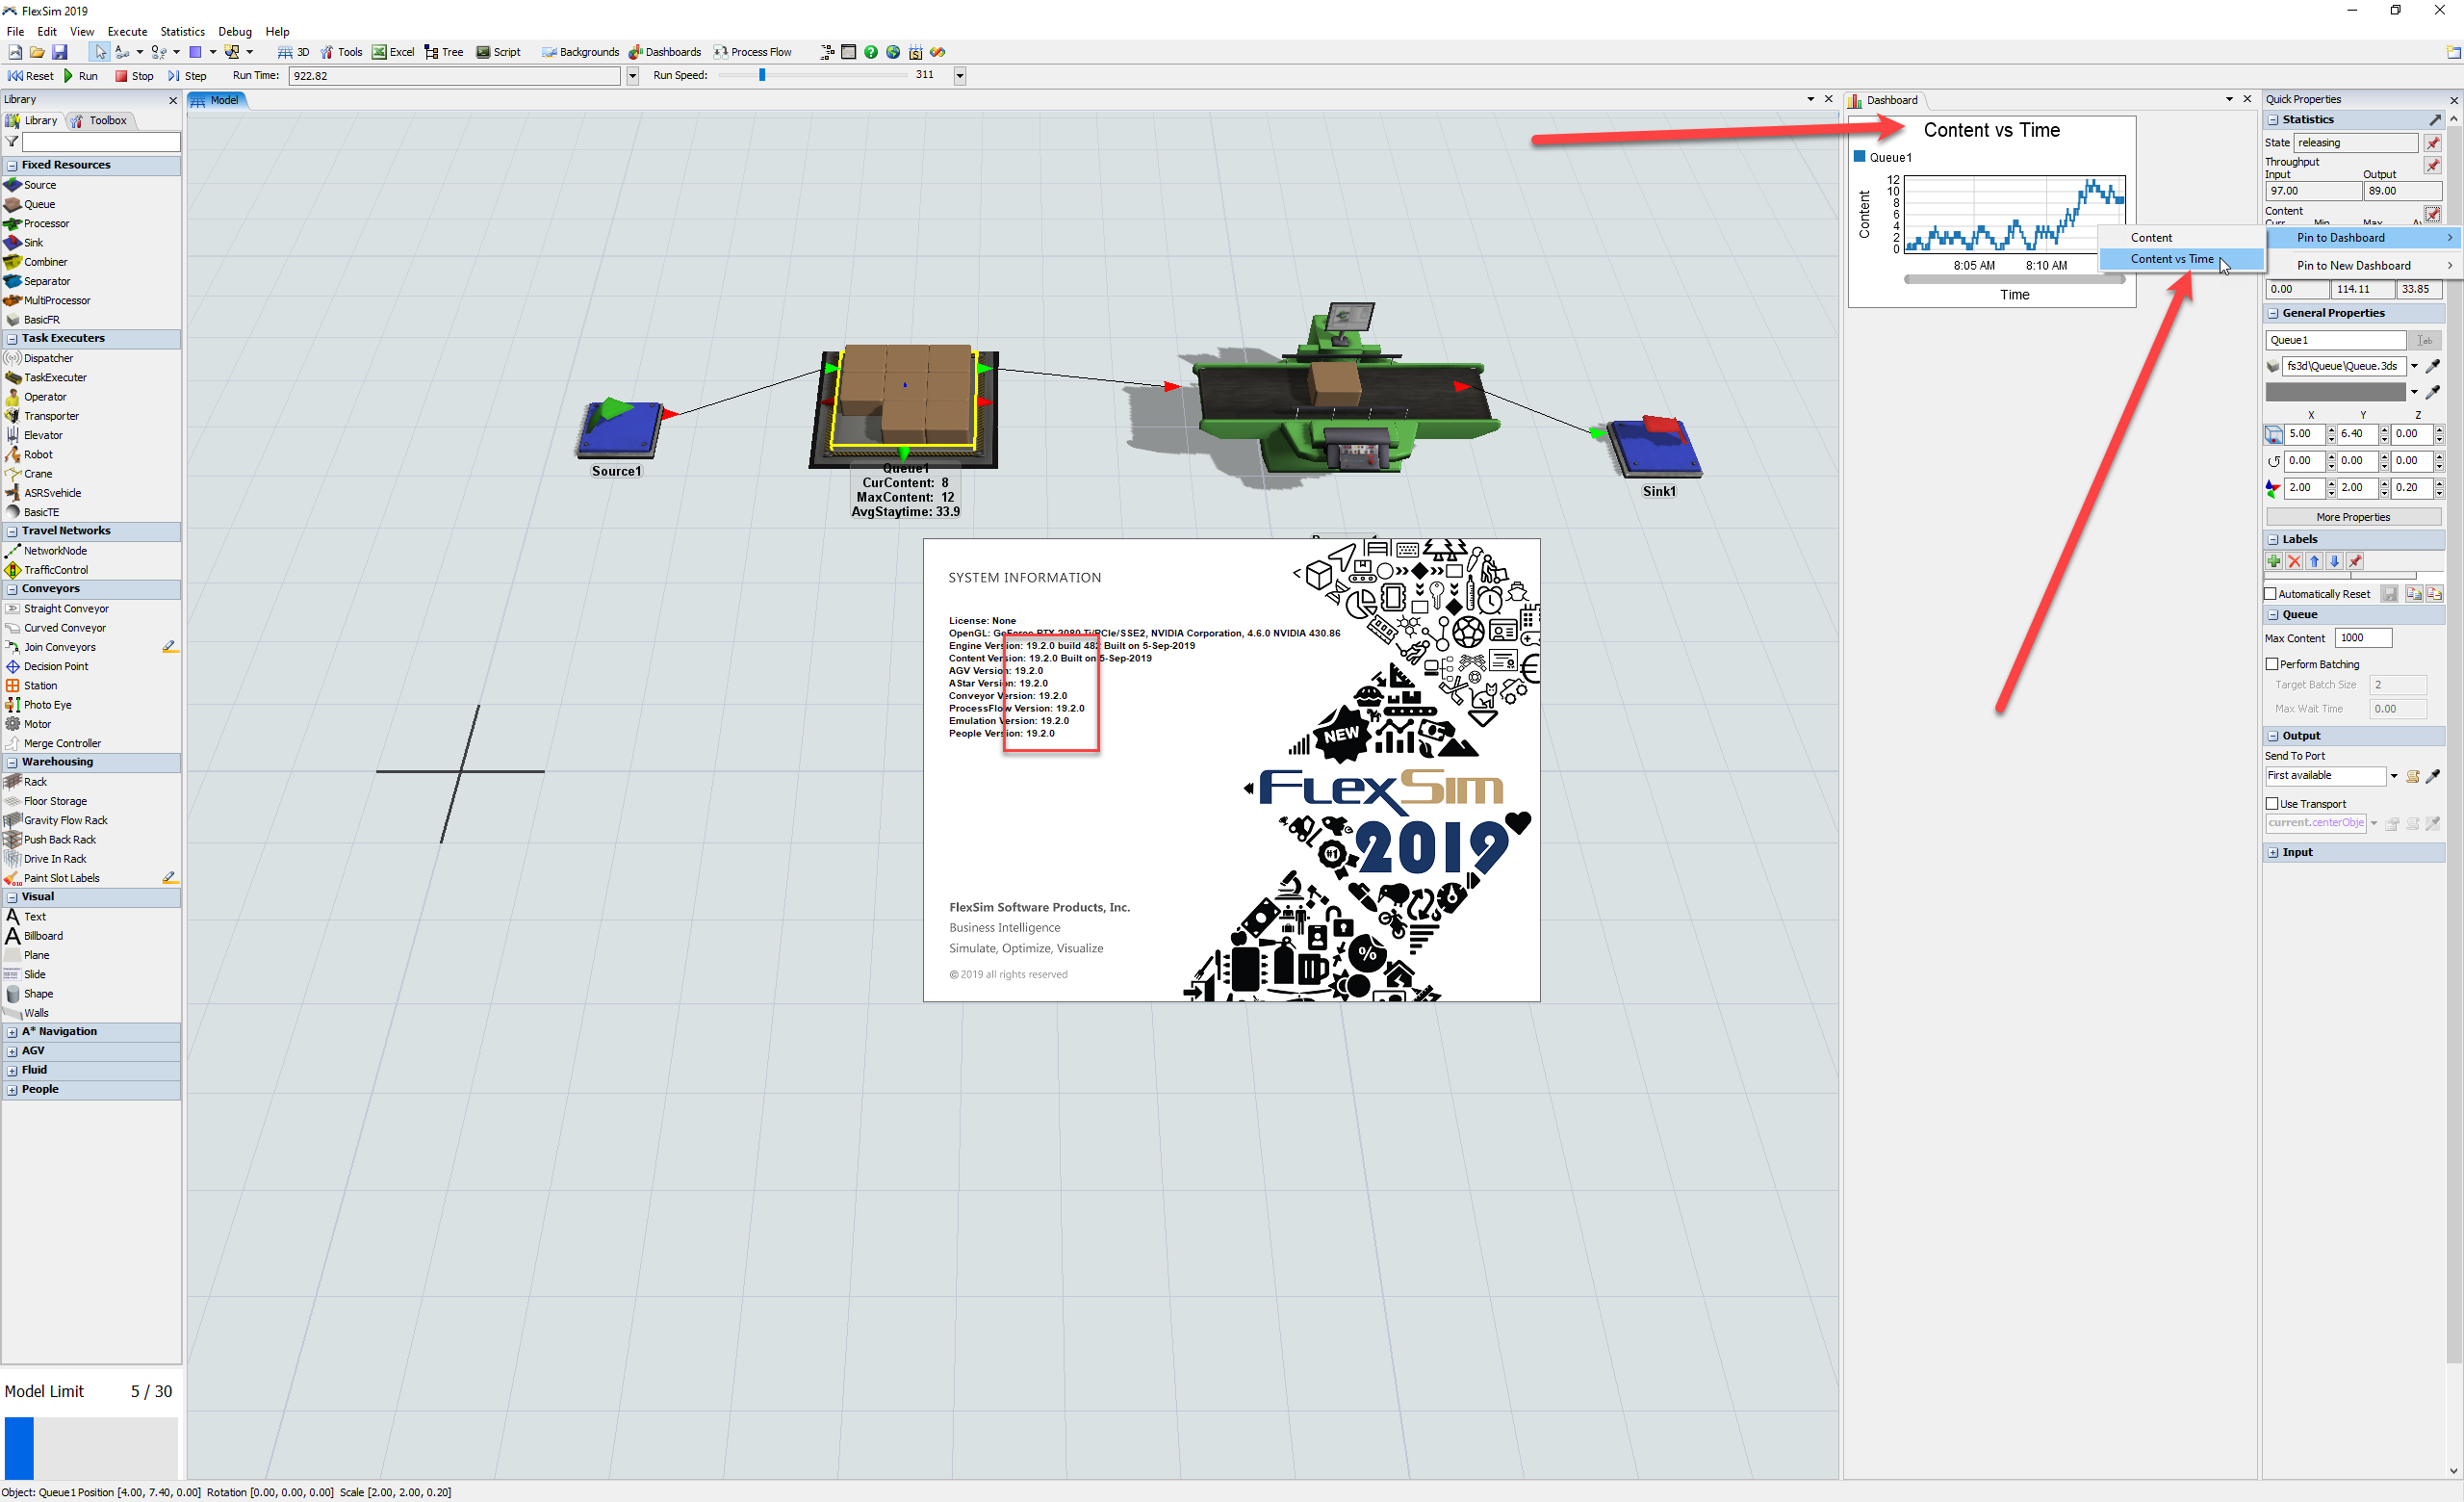
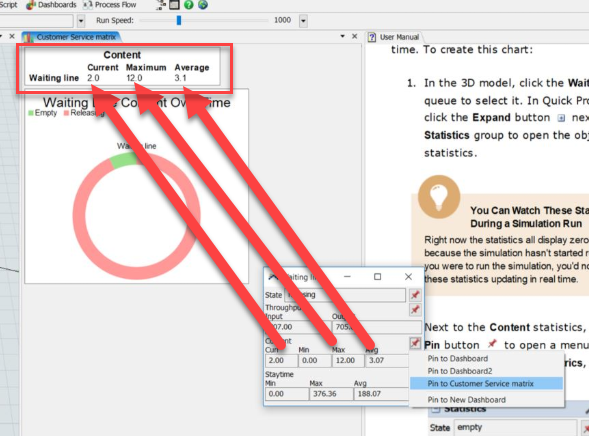
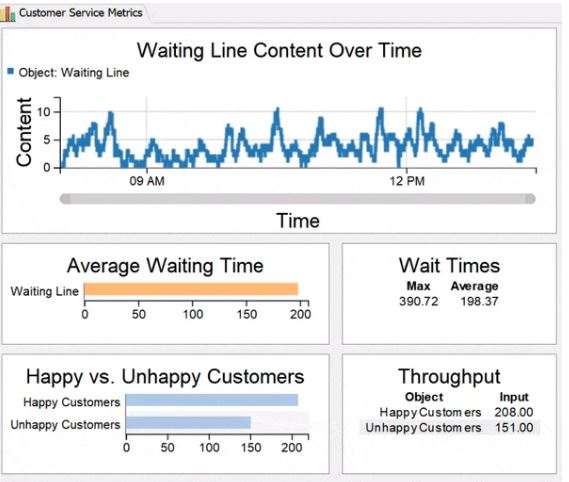
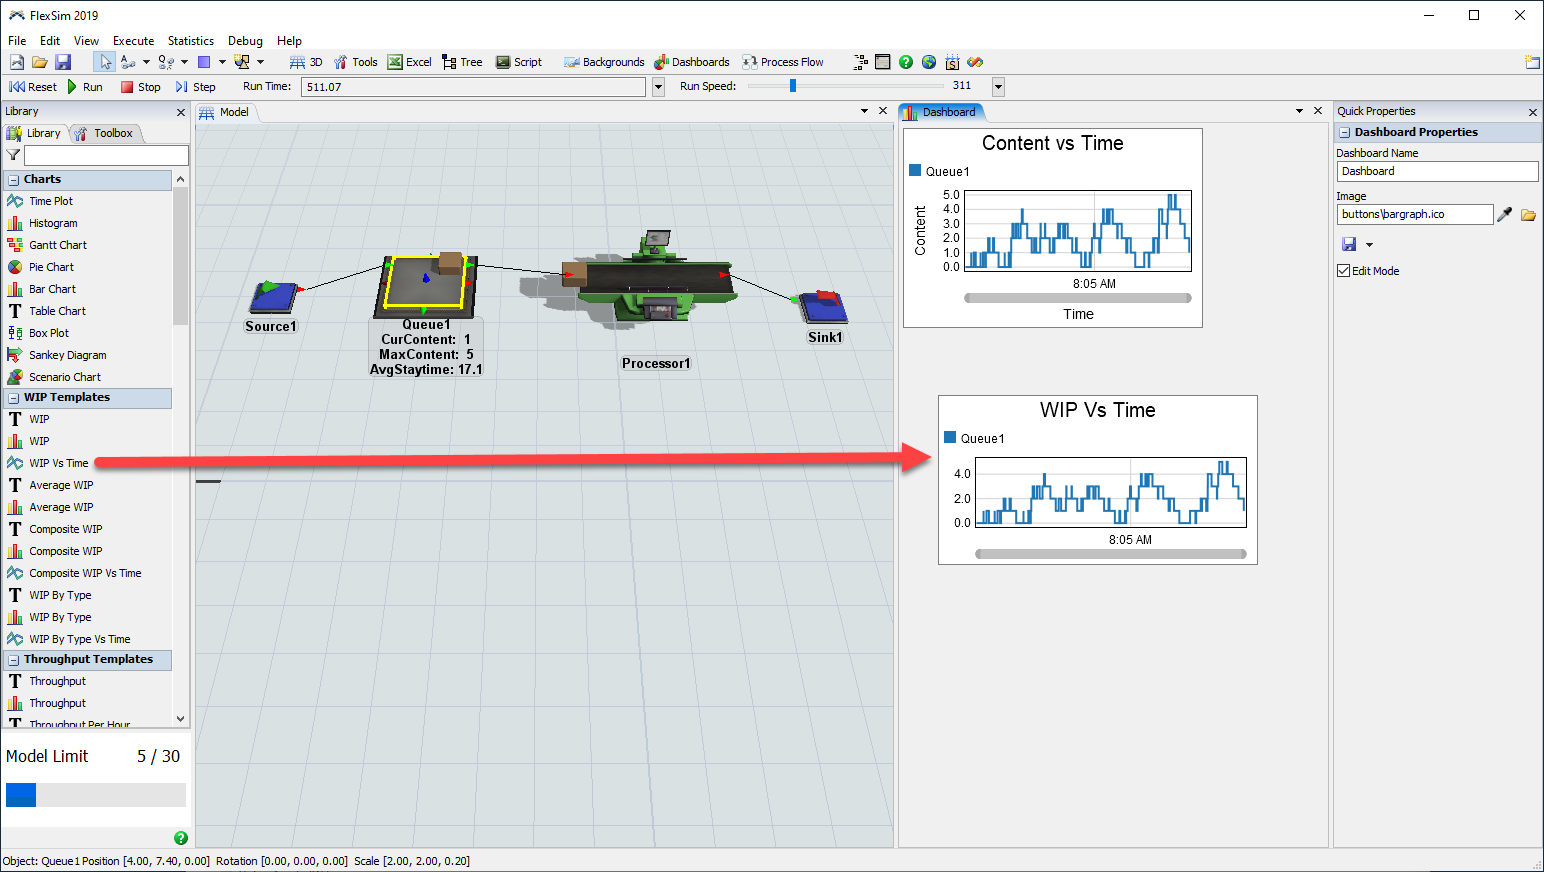
Capture 2 image is when I want to plot content vs time but this chart does not pop up under the statistics pins. How do I get this chart?

Thanks for the help.

capture-3.jpg

capture-2.jpg

FlexSim 19.2.1
graphscontent vs time chartstatistics pin
capture-3.jpg (150.9 KiB)
capture-2.jpg (136.7 KiB)
· 4
5 |100000

Up to 12 attachments (including images) can be used with a maximum of 23.8 MiB each and 47.7 MiB total.

Phil BoBo avatar image Phil BoBo ♦♦ commented ·

Please post a model demonstrating your issues.

We can't tell how you created your "Waiting Line Content Over Time" chart from the attached screenshot "capture3."

The chart you are pinning in "capture2" is in the dashboard shown in that image:

Again, if something is wrong with that case, we can't tell from the attached picture. Please attach a model with an explanation of what you are trying to do, what you expected to happen, and what actually happens.

1 Like 1 ·
chart.png (215.6 KiB)
Azra S2 avatar image Azra S2 Phil BoBo ♦♦ commented ·

@phil.bobo thanks for getting back to me. My model is attached. model.jpg

I am trying to get data from my model using various simulation tools such as dashboards, charts, and statistics collectors. Hence I am familiarising myself with these functions on Flexsim.

I would like to get graphs as shown in attachment graphs-in-flexsim.jpg but realise the version I am using 19.2.0 does not have a Content vs Time chart. Is there an alternative way I can plot this information?

Furthermore, under the Data source for statistics collector, the "split data by" tab, there should be options like "object", "time", "average", "Input", "output" that I can choose from (see image data-source.jpg). For some reason it appears blank to me.

When I want to create a Custom Statistics Collector (in my model throughput), from this image throughput.jp, you can clearly see for "include" tab, it is empty. Ideally it should show "object", "input", "output" but doesn't.

Hope I have explianed it more clearly. Thanks Azra.

0 Likes 0 ·
model.jpg (150.9 KiB)
data-source.jpg (23.9 KiB)
throughput.jpg (34.7 KiB)
Phil BoBo avatar image Phil BoBo ♦♦ Azra S2 commented ·

You posted an image of your model. I asked you to post your model itself. The fsm file, not a jpg file.

We can't explain to you what is happening with just still images. You need to post the actual model file.

FlexSim 19.2.0 has a Content vs Time chart. Use the pin button in Quick Properties instead of the popped out panel:

You can also get a Content vs Time chart by dragging a WIP Vs Time chart into a dashboard:

Your "throughput.jpg" image doesn't have enough information in it to explain why it is not doing what you want. You need to post the model for us to know what is happening; not just images. We cannot explain why it "appears blank to you" based on an image. We need the model.

Based on the image, it looks like you dragged a Table Chart into your dashboard and double-clicked on it. That properties window is a Table Chart properties window, not a Statistics Collector. Statistics Collector properties look like this:

Your Table Chart properties window will change its options based on the data available in the specified Data Source. If you run your model and then close and reopen that window, you may have different options.

2 Likes 2 ·
content-vs-time.png (413.3 KiB)
wip-vs-time.png (140.1 KiB)
Show more comments

1 Answer

·
Phil BoBo avatar image
1 Like"
Phil BoBo answered Azra S2 commented

Your graphs are blank because your model isn't doing anything.

Your source isn't connected to anything. Nothing ever enters your Waiting Line object:

Perhaps you should contact your local distributor for training: Saker Solutions Limited

When you click save, the model resets so the data for the graphs is reset and their contents are reset. That's supposed to happen. There's no data to display when the model is reset.


no-source.png (157.5 KiB)
· 1
5 |100000

Up to 12 attachments (including images) can be used with a maximum of 23.8 MiB each and 47.7 MiB total.

Azra S2 avatar image Azra S2 commented ·

Thanks @phil.bobo

0 Likes 0 ·

Write an Answer

Hint: Notify or tag a user in this post by typing @username.

Up to 12 attachments (including images) can be used with a maximum of 23.8 MiB each and 47.7 MiB total.