question

Tee Hiett avatar image
0 Likes"
Tee Hiett asked Matthew Gillespie answered

How can I select the x-axis scales for graphs on the dashboard?

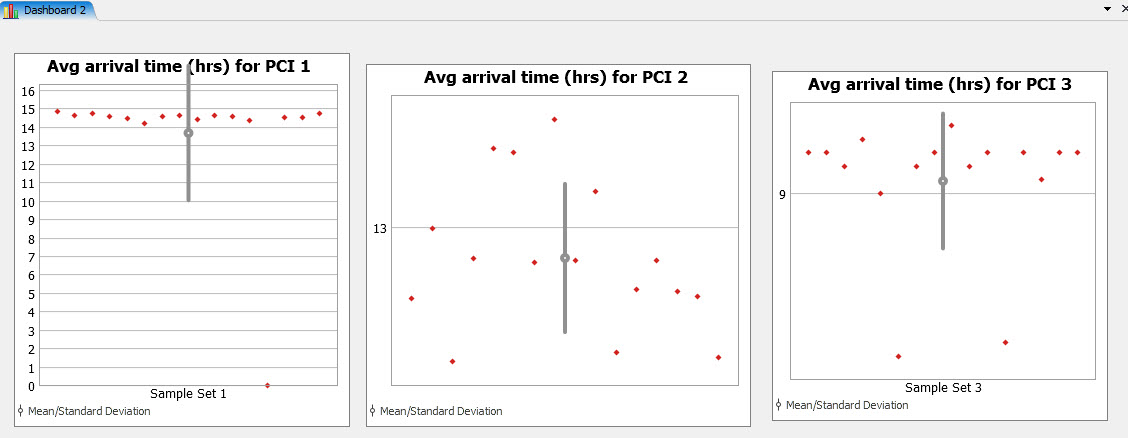
I have the three graphs shown below in which the scale for the x-axis was chosen by the program. I would like the scale on the x-axis on all three graphs to be exactly like the one for PCI 1, the graph on the left. Or better yet, I would like the X axis scale for all three graphs to be from 7-16.

Suggestions?

Thanks, Tee

FlexSim HC 5.1.0
dashboardshealthcaregraphs
· 1
5 |100000

Up to 12 attachments (including images) can be used with a maximum of 23.8 MiB each and 47.7 MiB total.

Tee Hiett avatar image Tee Hiett commented ·

Attached is a JPEG file with the graphics I was referring to.

0 Likes 0 ·
Matthew Gillespie avatar image
0 Likes"
Matthew Gillespie answered

It doesn't look like there's a way to scale the y-axis. It just automatically scales to fit all the points. Your first graph has a bigger scale because one of the data points is 0. You might be able to plot all three PCI's in one graph, that way they'd share the same y-axis.

5 |100000

Up to 12 attachments (including images) can be used with a maximum of 23.8 MiB each and 47.7 MiB total.

Joerg Vogel avatar image
0 Likes"
Joerg Vogel answered

Beside I can't see anything below your question. I would try to place all graphs inside one chart object. Then I place a fourth graph with just two entries one at the time 7 and one at 16. This forces the other graphs to fit into this interval as long as there aren't other values before 7 or later than 16.

5 |100000

Up to 12 attachments (including images) can be used with a maximum of 23.8 MiB each and 47.7 MiB total.

Write an Answer

Hint: Notify or tag a user in this post by typing @username.

Up to 12 attachments (including images) can be used with a maximum of 23.8 MiB each and 47.7 MiB total.