question

Miguel C12 avatar image
0 Likes"
Miguel C12 asked Felix Möhlmann answered

Dashboard that shows the information for each patient in my model

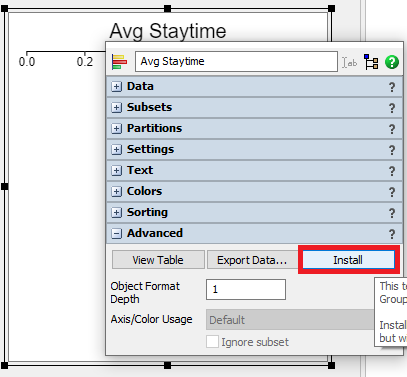
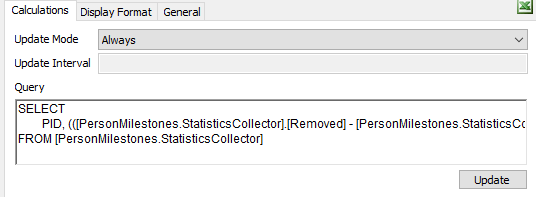
I want to study how the change of continuous vs discrete examination has an effect on the staytime of the patients. Is there a way to show in the dashboards as many bars as patients my model has? Right now it is showing a single bar that is updating as a patient leaves the model.

Thank you,

Discreto.fsm

FlexSim 21.2.4
dashboardshealthcare
discreto.fsm (79.2 KiB)
5 |100000

Up to 12 attachments (including images) can be used with a maximum of 23.8 MiB each and 47.7 MiB total.

1 Answer

·
Felix Möhlmann avatar image
0 Likes"
Felix Möhlmann answered

First, install the components of the chart.

1636459099762.png

Now, you should find the calculated table "Staytime CalculatedTable" in the toolbox. Open it's properties and navigate to the "Calculations" tab. Activate the manual editing and remove the "SUM" from the second line. If you want to, you can add "PID, " in front to later show the PID of each patient in the chart.

1636459512245.png

Now reset the model and let it run once, to update the chart options.

Then you can configure it to show the Staytime with the PID as bar label (and color).

discreto_1.fsm


1636459099762.png (19.2 KiB)
1636459512245.png (6.6 KiB)
discreto-1.fsm (83.9 KiB)
5 |100000

Up to 12 attachments (including images) can be used with a maximum of 23.8 MiB each and 47.7 MiB total.

Write an Answer

Hint: Notify or tag a user in this post by typing @username.

Up to 12 attachments (including images) can be used with a maximum of 23.8 MiB each and 47.7 MiB total.