Looking for help on creating dashboards in 2020 HC. All the demos and training seem to cover the standard 2020 dashboards and or gloss over the HC templates. Trying to create a basic census over time (including Max Census) for a waiting room location but can't figure it out. Any advice on that dashboard and any advice on where to go to learn how to use the 2020 dashboards? They are very different from the older HC versions. Thanks
Hi @Michael Zabritski,
To get a census over time of a location (like the waiting room) in a Dashboard, you will need to go to the Location section of the dashboard. In there you will find an option for "Census". There will be a small icon next to it that you can click and you will see the Line Chart option.
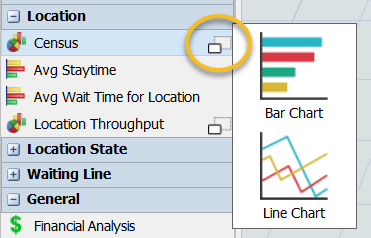
This is the chart you use for the Census of a Location over Time.
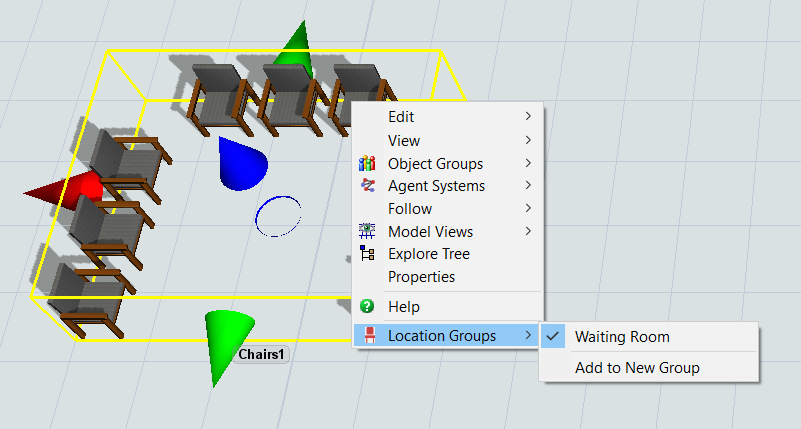
Next, in the properties window for the chart you will want to go to the Subsets Tab. Here you can select which locations to report the Census information for. In order to do this properly, you must make sure that your Waiting Room is in a Locations Group. You can do this by right clicking on the Waiting Room and going down to the Location Groups and selecting "Add to New Group" as seen below.
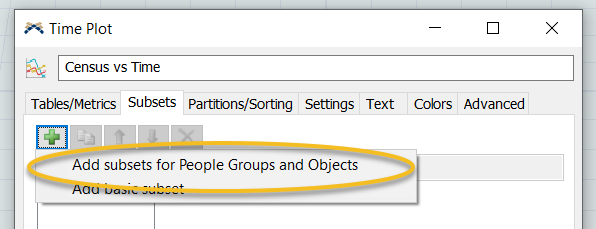
With the location in a group, you can now use the Subsets to filter out all the other locations in your model that you are not interested in. Subsets in Dashboards are used to filter information into smaller groups. In order to filter out all locations other than the Waiting Room, you will need to add a Subset by clicking on the Green Plus Sign and selecting "Add subsets for People Groups and Objects" as seen below.
This will then give you a list of all Location Groups in your model. Here is where you can select your Waiting Room Group and get the results for only those locations. This is why the Group is so important to have.
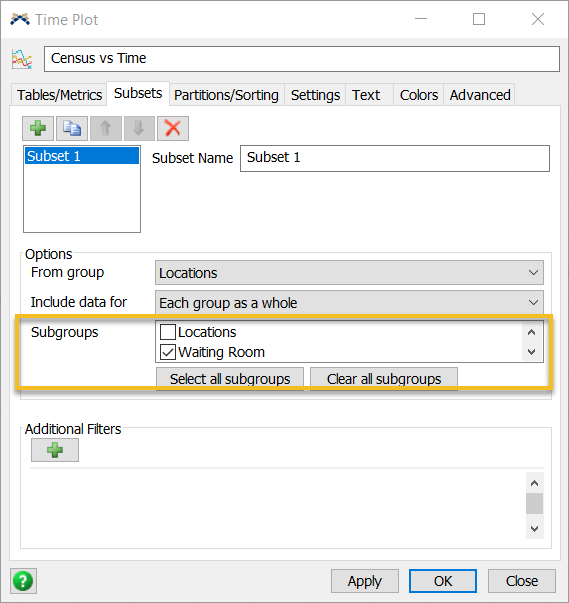
This will now make your Dashboard only report the information you are looking for.
There Dashboard Templates for people objects are also very well documented in our User Manual if you need more help. You can find them under Reference > People Objects > People Templates. You can find the Location Census vs Time under Location Templates.
Hope this helps.
14 People are following this question.
