question

John H4 avatar image
0 Likes"
John H4 asked Jordan Johnson commented

Incorrect Composite Throughput by Time Chart

Hi,

I tried to use composite throughput by time chart to track number of tasks passed through a group of processors every 30mins.

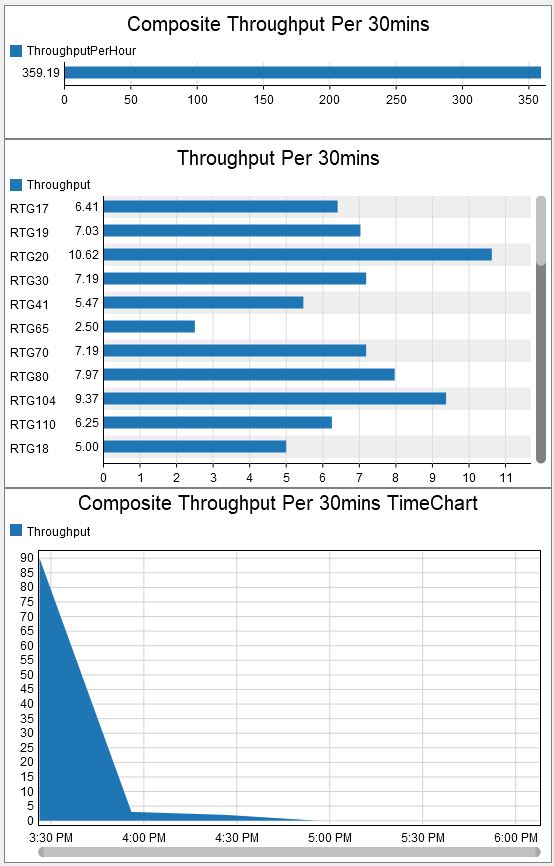
The top chart shows there are 300+ tasks passed through in last 30mins, and I observe the throughput is stable in last few 30mins interval. However the bottom composite throughput by time chart shows merely 90 tasks completed in first 30mins interval then drops to zero in later intervals.

What's wrong in the composite throughput by time chart?

FlexSim 19.2.0
throughput template
· 1
5 |100000

Up to 12 attachments (including images) can be used with a maximum of 23.8 MiB each and 47.7 MiB total.

Benjamin W2 avatar image Benjamin W2 commented ·

Hi @John H4,

Can you post a copy of your model? That will help is debug it.

Thanks!

0 Likes 0 ·

1 Answer

·
Jordan Johnson avatar image
2 Likes"
Jordan Johnson answered Jordan Johnson commented

Without a model, it is difficult to say. However, it is important to understand that the bar chart simply takes the total throughput and divides that number by the number of intervals. If there is a burst of throughput at the beginning, this value can get fairly large.

The throughput by time chart, on the other hand, totals up the number of throughputs in the previous half hour.

So, with that in mind, there may still be an issue. To debug that and help you further, you will need to post a model.

· 4
5 |100000

Up to 12 attachments (including images) can be used with a maximum of 23.8 MiB each and 47.7 MiB total.

John H4 avatar image John H4 commented ·

throughput-example.fsmLet me illustrate with a simple example.

Source2 outputs jobs every 60sec constantly and each job is processed by processor1 with 1sec only. So measuring throughput of processor should show roughly 60jobs per hr and the bar chart confirms it.

However the throughput by time chart shows nothing across time. I expect to see a line swinging near 60 after warmup.

what is the problem?

0 Likes 0 ·
ex1.jpg (100.2 KiB)
Jordan Johnson avatar image Jordan Johnson ♦♦ John H4 commented ·

In order to see data on the Throughput Per Hour 2 chart, you need to run the model for at least an hour. At that point, you will see a single point that represents the total throughputs between 8 and 9 a.m. To see a line, you need to run for another hour. Then a second point will appear, showing the total throughputs between 9 and 10 am, and the chart will draw a line between them. Running this model longer produces the following charts:

The two charts agree. Since the model is constant, the throughput per hour shows a constant rate of 60. Since an item does not arrive at time 0, the first hour only has 59 items. Both charts show a rate. The bar chart shows the average rate, and the time plot accumulates data per time period to calculate the rate.

0 Likes 0 ·
John H4 avatar image John H4 commented ·

Hi Jordan,

So you are suggesting that the bar chart shows "Total Number of Jobs passed through / Total Time" then normalizes to "Job per hr" figure?

What puzzles me is in my original case, the average number of job passed through the system is up to 300+/hr constantly but the composite throughput by time graph shows it drops to almost zero after one hour, which I know it's completely wrong. Sorry that I can't post my model here as it contains sensitive data to generate such result.

So put it this way, how can I generate a calculated table to compute:

1. Time series of Total number of job passed through a group of processors per 30mins

2. Time series of Total number of operators ever worked per 30mins

I need to have these 2 time series for every experiment replications, then compute the average figures of each 30mins interval over 100 replications.


Thanks.

0 Likes 0 ·
Jordan Johnson avatar image Jordan Johnson ♦♦ John H4 commented ·

If you want, you can always install a Chart Template to see how it works. In this case, if you choose to install it, you can find a Statistics Collector in your toolbox, with this code for a column:

Model.statisticalTime > 0 ? (data.rowValue.as(Object).stats.input.value * getprocessflowvar(data.rowValue.up, "Interval") / Model.statisticalTime) : 0<br>

This code says if the statistical time is positive, then you can calculate the total input divided by the statistical time, where the statistical time is converted to hours, or whatever your interval was. It basically comes down to:

total input / total hours

To get the total throughput vs time, you can make your own Process Flow and Statistics Collector. To view that data every 30 minutes over all replications, you can use a scenario chart; just be sure to set the sample rate to every half hour (1800 in seconds). The attached model does that.

groupthroughputvstimedemo.fsm

0 Likes 0 ·

Write an Answer

Hint: Notify or tag a user in this post by typing @username.

Up to 12 attachments (including images) can be used with a maximum of 23.8 MiB each and 47.7 MiB total.