question

Arief Samuel G avatar image
0 Likes"
Arief Samuel G asked Arief Samuel G commented

Why very different stay time for different flow configuration

Hello,

I have a problem with calculating the waiting time (stay time).

Short introduction of the model :

There is one work station that processes 3 types of products (A-red,B-green,C-yellow) arriving with a certain empirical distribution. Every order has different processing times (job shop). Every once in a while the work station also processes spare parts (blue). The machine and operator follows a 1 shift time table from 6 am to 2 pm for 5 days a week (the order arrival has already excluded weekends). The simulation is run for 3 years from 2017 to 2019.

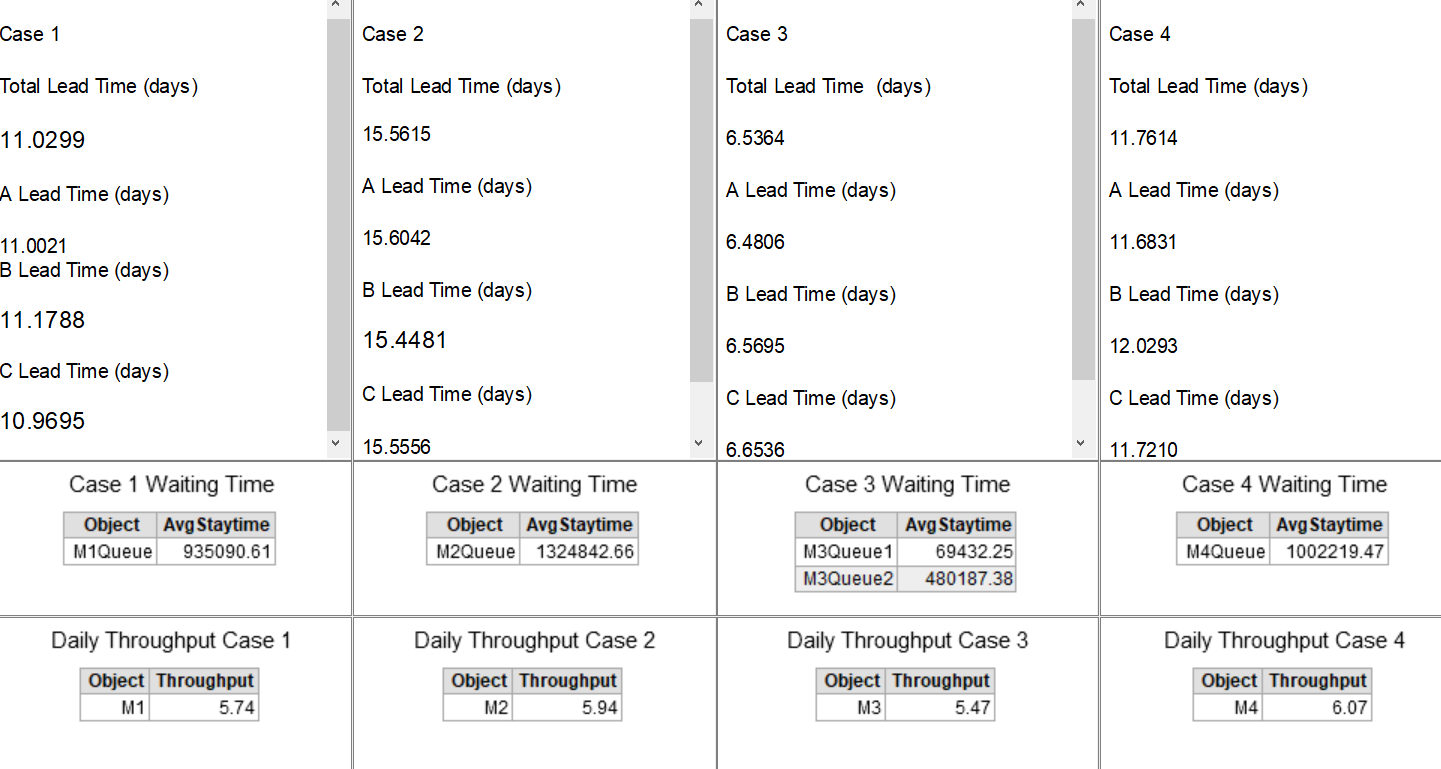
There are 3 main KPIs to be measured (Dashboard) : Lead Time of Product A-B-C, Waiting Time (Staytime) of orders in the queue, and the daily throughput.

The creation of the orders and the collection of KPI labels in the end are all done in Process Flow.

Loading of the orders to the machine is done mainly in 3D Model and I tried 4 different ways (cases) :

Case 1 : The flow is based on the 3D Model Object connection which flows naturally from the start. Not involving process flow to manage the operator.

Case 2 : Process flow (task sequence) and list is used to load the arriving orders directly to the machine

Case 3 : Same as Case 2 but the operator unloaded the order to another queue before the machine instead of directly to the machine (double queues are used here)

Case 4 : Same as case 1 but the downtime behavior for the machine when off shift is set to Stop and Resume Input instead of Stop and Resume Object

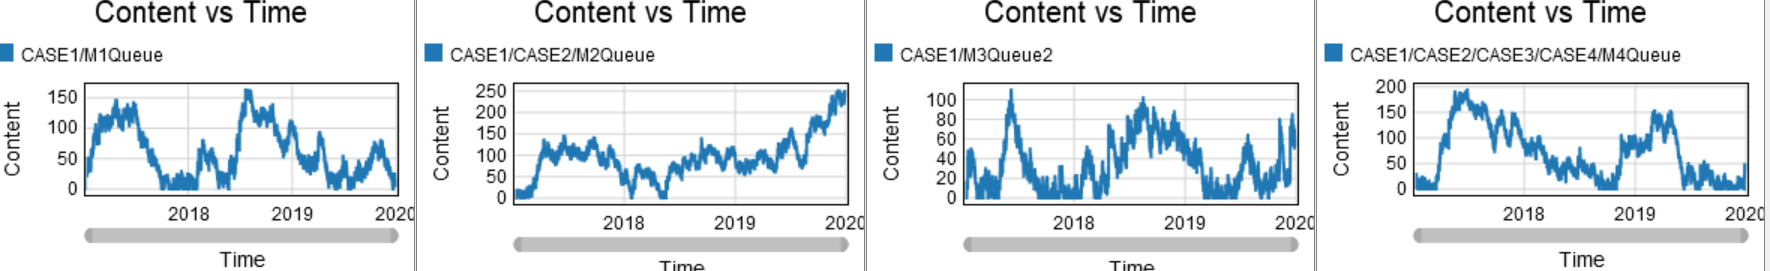
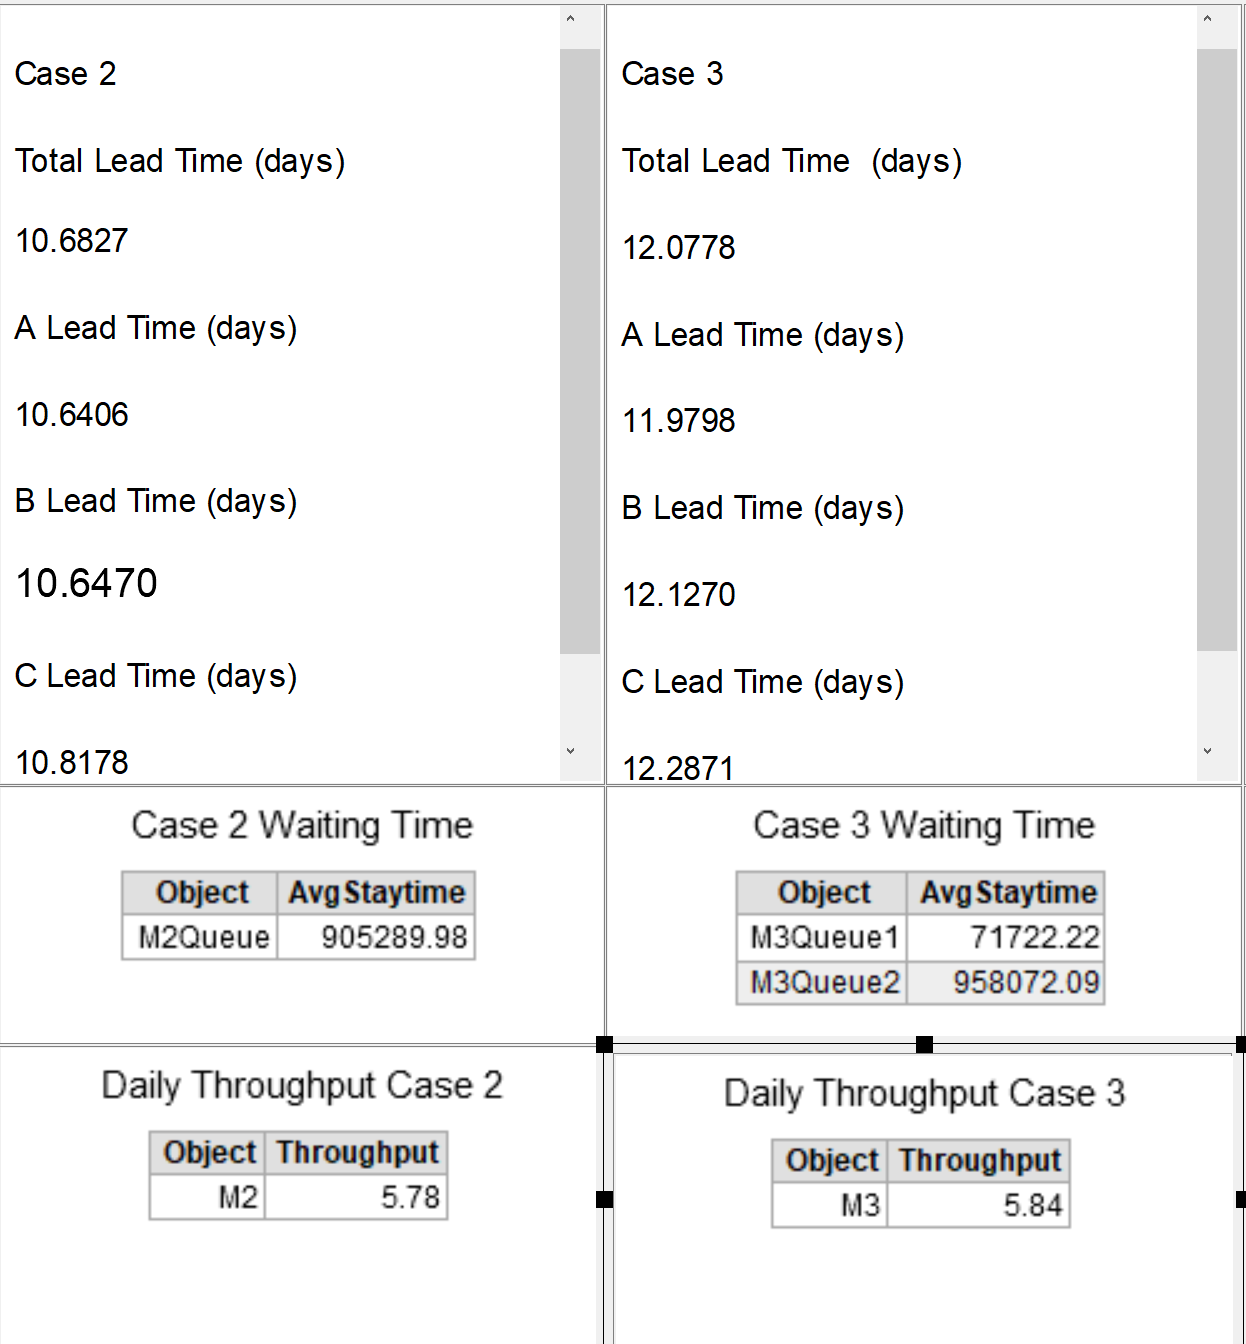
When I run the model all of the cases give quite different results as can be seen on the dashboard output sample below (especially for the stay time), whereas I expect more or less similar results for all 4 cases.

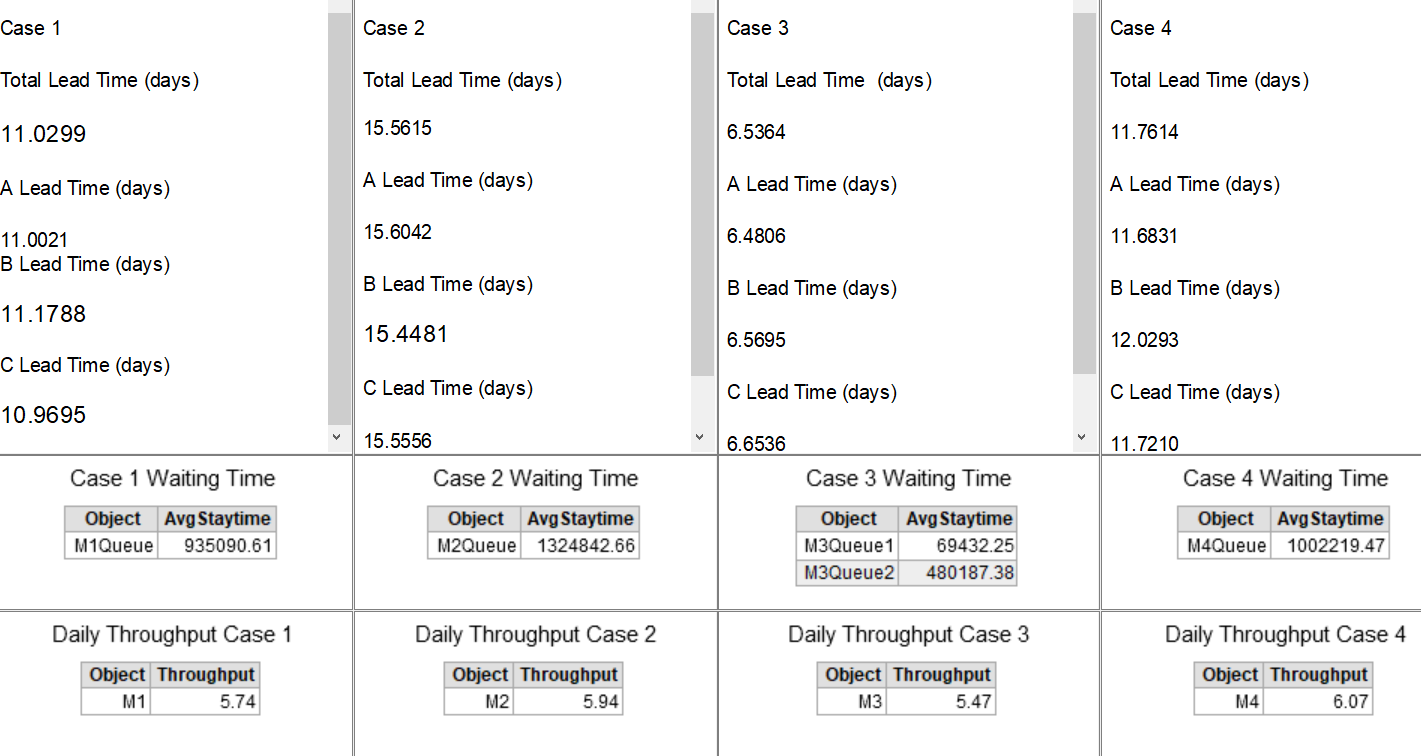
My main question is why the stay time results are very different and which case is the most accurate (or maybe there are other approaches) ? Or is there any assumptions or setting that I did wrong? accurate waiting time is the most important KPI for this model that will also affect the lead time.

Also in relation to case no 4, I still don't quite understand the difference between stop/resume object and stop/resume input(and or output) for the downtime behavior, because the result difference is quite large between them.

I attach here the model to be checked.

DifferentStayTime.fsm

Thank you beforehand and sorry if the model is not very well made (still newbie in Flexsim).


FlexSim 20.1.0
flexsim 20.1.0stay timedown time behaviour
1589227539576.png (111.0 KiB)
differentstaytime.fsm (202.5 KiB)
5 |100000

Up to 12 attachments (including images) can be used with a maximum of 23.8 MiB each and 47.7 MiB total.

1 Answer

·
Benjamin W2 avatar image
0 Likes"
Benjamin W2 answered Arief Samuel G commented

Hi @Arief Samuel G,

Process flow and the 3D logic are very similar, however the FlexSim engine executes them slightly differently. I am actually not surprised to see this level of variability in your results. I created a dashboard from your model to compare your Case 1 and Case 2. Also, you assigned your Operator 2 to your 3rd case (By mistake I think), which could have been changing your results:

As you can see in the "Content vs. Time" charts, the amount of variability in the arrivals is most likely the cause of the average staytime discrepancies. If you look at the "Throughput" charts, each processor is processing about the same amount of items over the simulation. Here is a snap of the other dashboard:

As you can see, the average staytime is about the same.

differentstaytime.fsm


1589219885887.png (1.2 MiB)
1589220072653.png (152.0 KiB)
differentstaytime.fsm (203.4 KiB)
· 9
5 |100000

Up to 12 attachments (including images) can be used with a maximum of 23.8 MiB each and 47.7 MiB total.

Arief Samuel G avatar image Arief Samuel G commented ·

Hi @Benjamin W2

Thank you so much for your answer. Really helpful.

Indeed I made a mistake with assigning the wrong operator in case 3. I updated the figure and model in the original question already.

So basically the arrival variability is the cause of very different stay time (due to every arriving order is one among 4050 possibilities of processing times).

The stay time and lead time from your screenshot looks very close.

Yet I tried again after fixing the operator problem and get the following result :

With the lead time and waiting time in quite a distance again. Also I observed that this time case 3 give much lower figures. Case 4 gives quite similar result to case 1 (which is quite strange since in my actual complete model the stop/resume input downtime behavior always give incredibly lower figures than stop/resume object).

Does it means that the high variability of arrivals will always yield wildly unpredictable result and the model will never be quite stable regardless of how we configure the operator loading orders to the machine?

So in this case which operator assignment method would you recommend to be chosen out of the 3 first cases?

And again, based on your experience, is it better to use stop/resume object or stop/resume input for downtime behavior?

Many thanks again beforehand


0 Likes 0 ·
1589227017790.png (112.6 KiB)
1589227035302.png (135.7 KiB)
Benjamin W2 avatar image Benjamin W2 Arief Samuel G commented ·

It looks to me like the high variability of arrivals is the cause of such different results. It is almost like a ripple effect through your model, and looks to be your bottle neck.

I would definitely recommend the process flow method. It gives you maximum control over the process and customization.

I would also recommend using the stop/resume object, because then it will load into your state charts on a dashboard.

Good luck with the project! Let us know if you have any more questions!

1 Like 1 ·
Brandon Peterson avatar image Brandon Peterson ♦ Benjamin W2 commented ·

@Arief Samuel G

Here is your model with some changes that forces each case to run the same items with the same process times, percentages, etc. Basically one token has all the possible variables set on it and then creates a duplicate in each of the cases.

Now the variability of your process times, item quantity, spare part percentage, etc. is the same for each case (at least as much as I could make it). The result is that there is almost no difference between case 1 and 2, case 3 has slightly better performance, and case 4 is much better.

The very small difference between case 1 and case 2 is due to the difference between the default task sequence given to an operator when using the flow tab (case 1) and the task activities you were using in process flow (case 2). The default task sequence has a travel task before the load and another before the unload. The result is that the operators travel to a very slightly different location.

The slight increase in performance for case 3 is expected because some of the travel time is done while the processor is busy with other items.

The performance boost for case 4 is expected as well. The reason for this is that by calling stopinput instead of stopobject you are allowing the processor to finish processing the item that is in it during the off shift. I would guess that it would end up being about 1/2 the average process+setup time for 1 item each down period.

The reason that you were seeing so much variability before was simply that there was that much variability in your model. Had you run the model for a much longer time period the cases would eventually have averaged out to be as similar as the results below.

I hope this helps explain things for you,

Brandon

differentstaytime_1.fsm

@Benjamin W2

1 Like 1 ·
Show more comments
Arief Samuel G avatar image Arief Samuel G commented ·

Hi @Benjamin W2

Thanks a a lot for your suggestions. Just one more question, would it be more accurate to use case 2 or case 3 (both use process flow)? In this example case 2 gives higher lead time and waiting time, but in my original model it's the other way around and the gap is incredibly high (could be more than 100fold, as can be seen in the picture below). So in terms of best practice is it better to pull and drop directly to the processor or pull and drop to another queue (both controlled with process flow)?


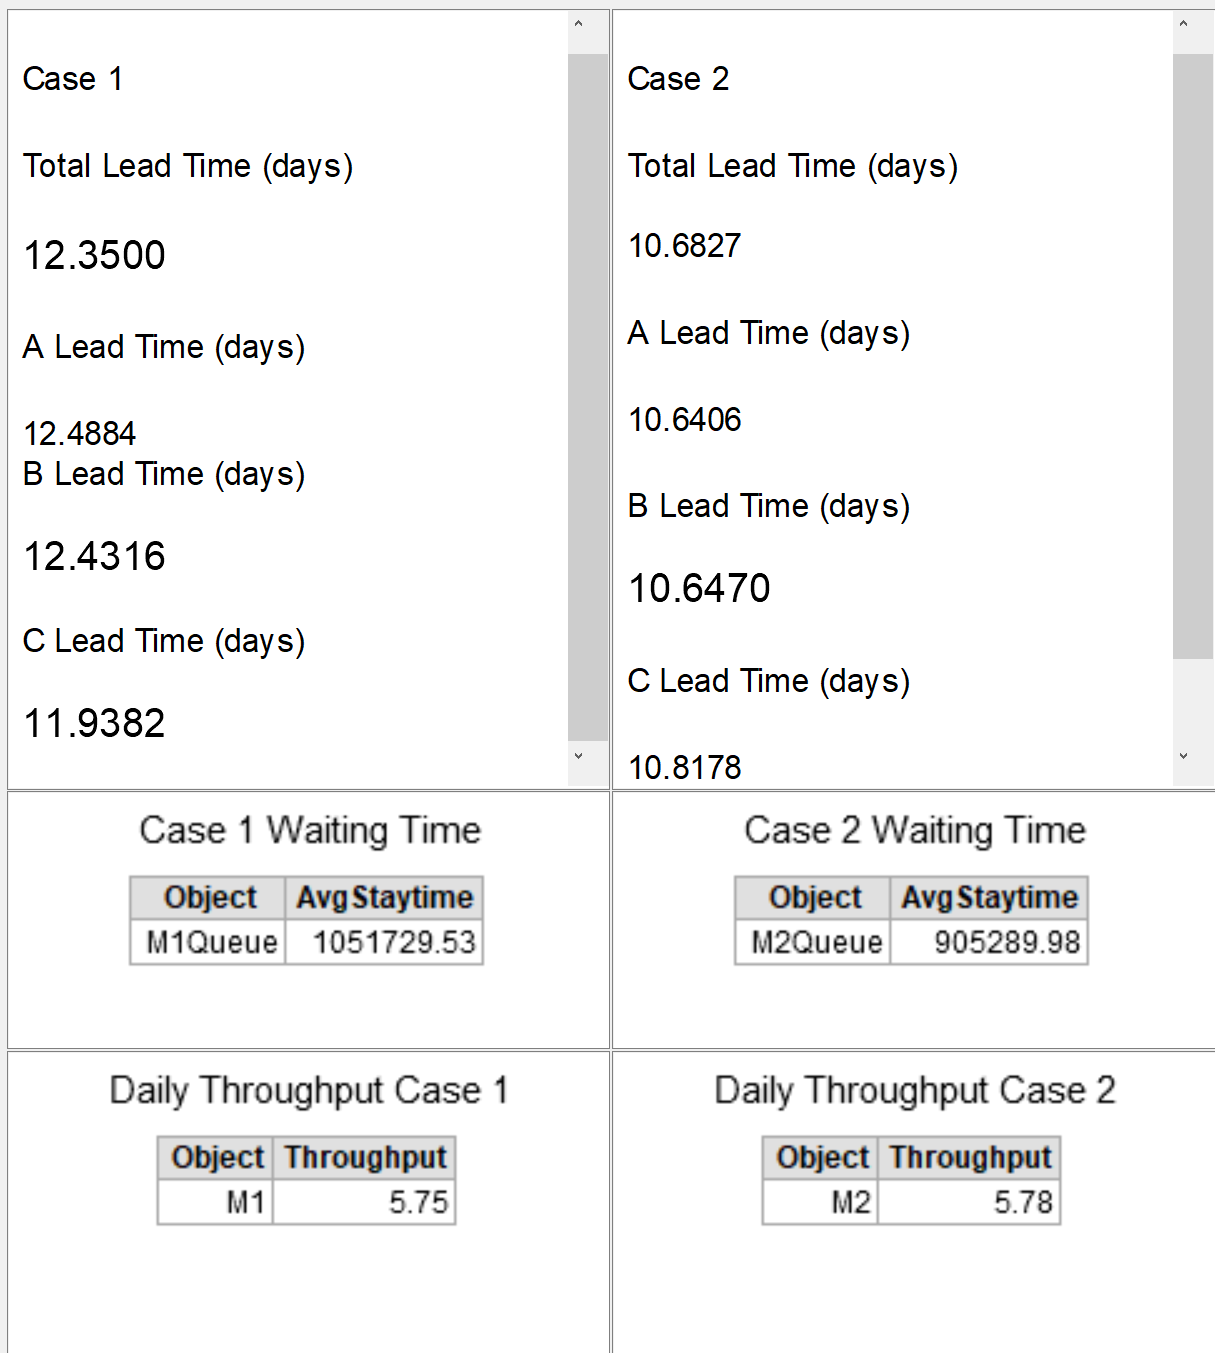
I only changed the unload destination from the processor to additional queue before the processor (like in case 3) and this was the result.

@Brandon Peterson : based on your explanation this condition indicates an error in the logic because both should give quite similar result right? Do you have any suspect of the cause of these differences? Thank you beforehand.

0 Likes 0 ·
Benjamin W2 avatar image Benjamin W2 Arief Samuel G commented ·

@Arief Samuel G, I guess that just depends on the process that you are trying to model. Also, I noticed that your "Machine M3" resource was pointing to your case 2 processor. After changing that, I did not see a big discrepancy between the 2 cases:

1 Like 1 ·
1589297231126.png (192.9 KiB)
Arief Samuel G avatar image Arief Samuel G Benjamin W2 commented ·

Hi @Benjamin W2 yes indeed I made a mistake in the model and now I fixed it already (also in the original question for others to check if they encounter similar problems). Now the difference is not that much. So there must be some other issues with my original model, because otherwise all cases should point to quite similar results. I will try to check that. Many thanks again for your inputs and suggestions.

0 Likes 0 ·

Write an Answer

Hint: Notify or tag a user in this post by typing @username.

Up to 12 attachments (including images) can be used with a maximum of 23.8 MiB each and 47.7 MiB total.