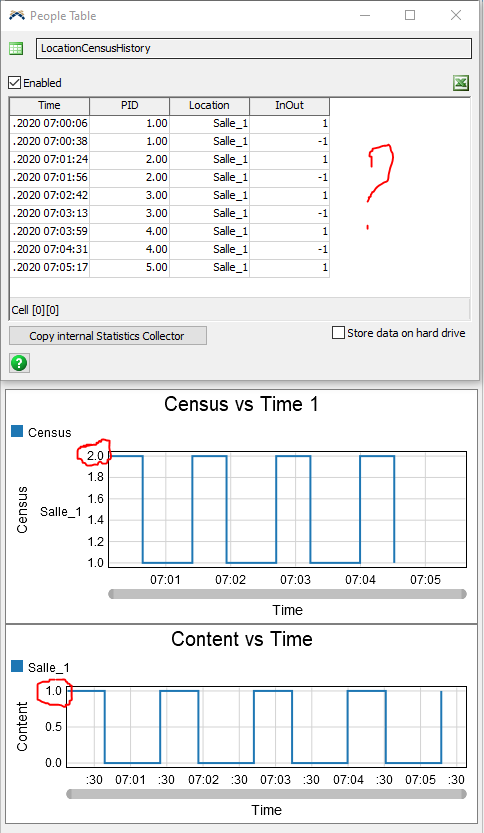
Hi, the census graph displays 2 on the scale, while the max content is at 1....
Problem appears at : 425.32min.
(well, the results data seems good).
Hi, the census graph displays 2 on the scale, while the max content is at 1....
Problem appears at : 425.32min.
(well, the results data seems good).
I'm not very familiar with People Stats Collectors, but based on what I gathered from the tables, it looks like there's a "FloorSpot" location that's counted in some of the census data. By creating a partition for Salles only, the graph matches what you'd anticipate with a max of 1 and range of 0-1 rather than a max of 2 and a range of 1-2.
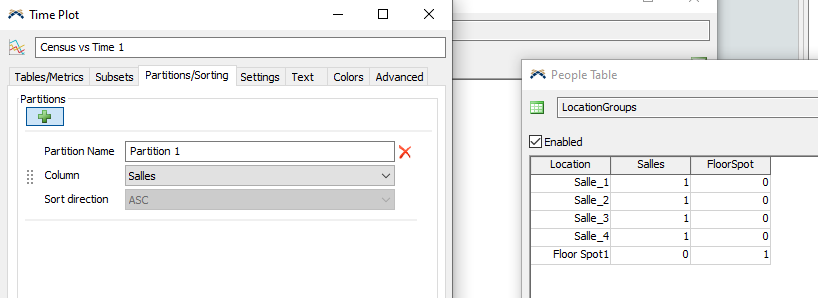
Let me know if this works for you.
13 People are following this question.
FlexSim can help you understand and improve any system or process. Transform your existing data into accurate predictions.
FlexSim is a fully 3D simulation software environment. FlexSim can be used to simulate any process in any industry.
FlexSim®, FlexSim Healthcare™, Problem Solved.®, the FlexSim logo, the FlexSim X-mark, and the FlexSim Healthcare logo with stylized Caduceus mark are trademarks of FlexSim Software Products, Inc. All rights reserved.
May we collect and use your data?
Learn more about the Third Party Services we use and our Privacy Statement.May we collect and use your data to tailor your experience?
Explore the benefits of a customized experience by managing your privacy settings for this site or visit our Privacy Statement to learn more about your options.