question

Lorenz N avatar image
0 Likes"
Lorenz N asked Ben Wilson commented

Flexsim Statistics: How to "pin" and analyze a group? Min, Max, Avg

How does one analyze a group location? I am currently using Flexsim 2020 in the HC environment. Currently for the dashboard there are prebuilt templates that you can easily drag and drop. They can anaylze the averages of group of locations.

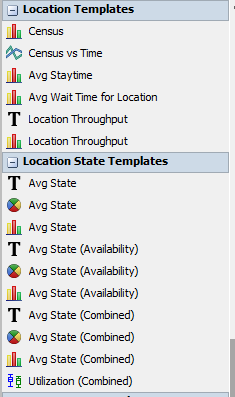
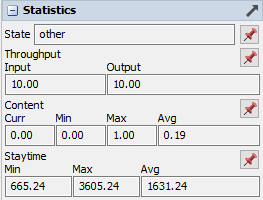
However, they can not do the Min or Max of a group. You can pin some statistics from the quick properties to get the Min and Max of an individual location.

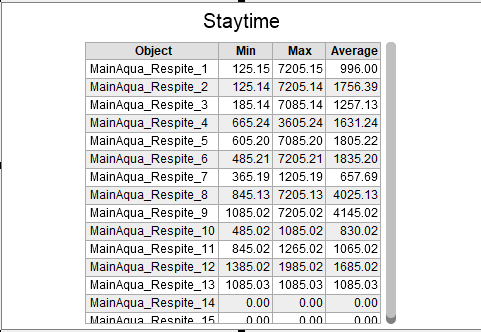
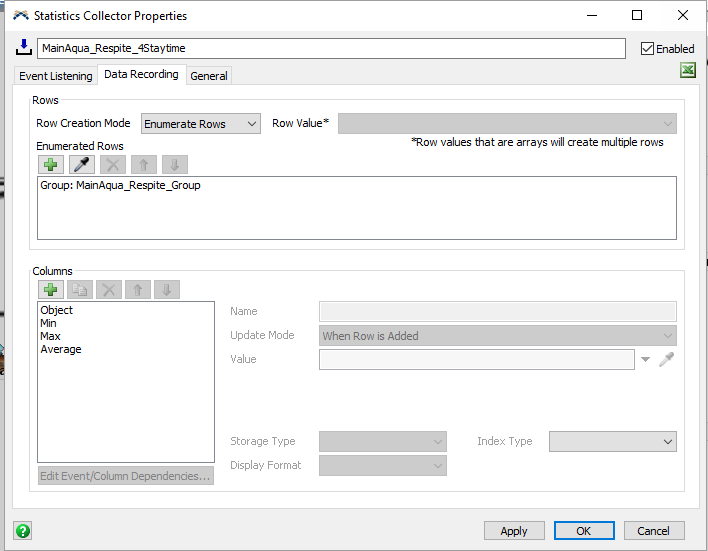
However the same can not be said of a group of locations. The most you can do is change the statistics collector to pull from a group. But they still only do the Min and Max for the individual.

Is there something I am missing? Is this possible? I hope I explained myself well.

FlexSim 20.0.7
statistics collectorflexsim 20.0.7healthcare hcpin to dashboardstatistics pin
1593702692046.png (12.3 KiB)
1593702800425.png (5.4 KiB)
1593702882954.png (22.6 KiB)
1593702888667.png (22.6 KiB)
1593702942539.png (18.9 KiB)
· 2
5 |100000

Up to 12 attachments (including images) can be used with a maximum of 23.8 MiB each and 47.7 MiB total.

tannerp avatar image tannerp commented ·

@Lorenz N,

You can use a Calculated Table to pull the min/max of a group with the information you're already collecting in your Stats Collector. I didn't see you post an example model, but if you're willing to post one, I can help you set this up.

Essentially, you will just use an aggregate MIN and MAX query in a calculated table to pull the max values from the table you displayed above. Hopefully I understood correctly, but this should be possible with a Calculated Table.

0 Likes 0 ·
Ben Wilson avatar image Ben Wilson ♦♦ commented ·

Hi @lorenz.n, was jeff.nordgren's answer helpful? If so, please click the red "Accept" button on their answer. Or if you still have questions, add a comment and we'll continue the conversation.

If we haven't heard back from you within 3 business days we'll auto-accept an answer, but you can always unaccept or comment back to reopen your question.

0 Likes 0 ·

1 Answer

·
Jeff Nordgren avatar image
0 Likes"
Jeff Nordgren answered

@lorenz.n,

Attached is a sample model of how you can get stats on a group using Process Flow Zone.

Would something like this work for your situation?

Thanks.

ZoneStats-JN1.fsm


zonestats-jn1.fsm (57.6 KiB)
5 |100000

Up to 12 attachments (including images) can be used with a maximum of 23.8 MiB each and 47.7 MiB total.

Write an Answer

Hint: Notify or tag a user in this post by typing @username.

Up to 12 attachments (including images) can be used with a maximum of 23.8 MiB each and 47.7 MiB total.