question

Jun J2 avatar image
0 Likes"
Jun J2 asked Ben Wilson commented

hourly utilization rate of statistics table in experimenter

@Jordan.Johnson

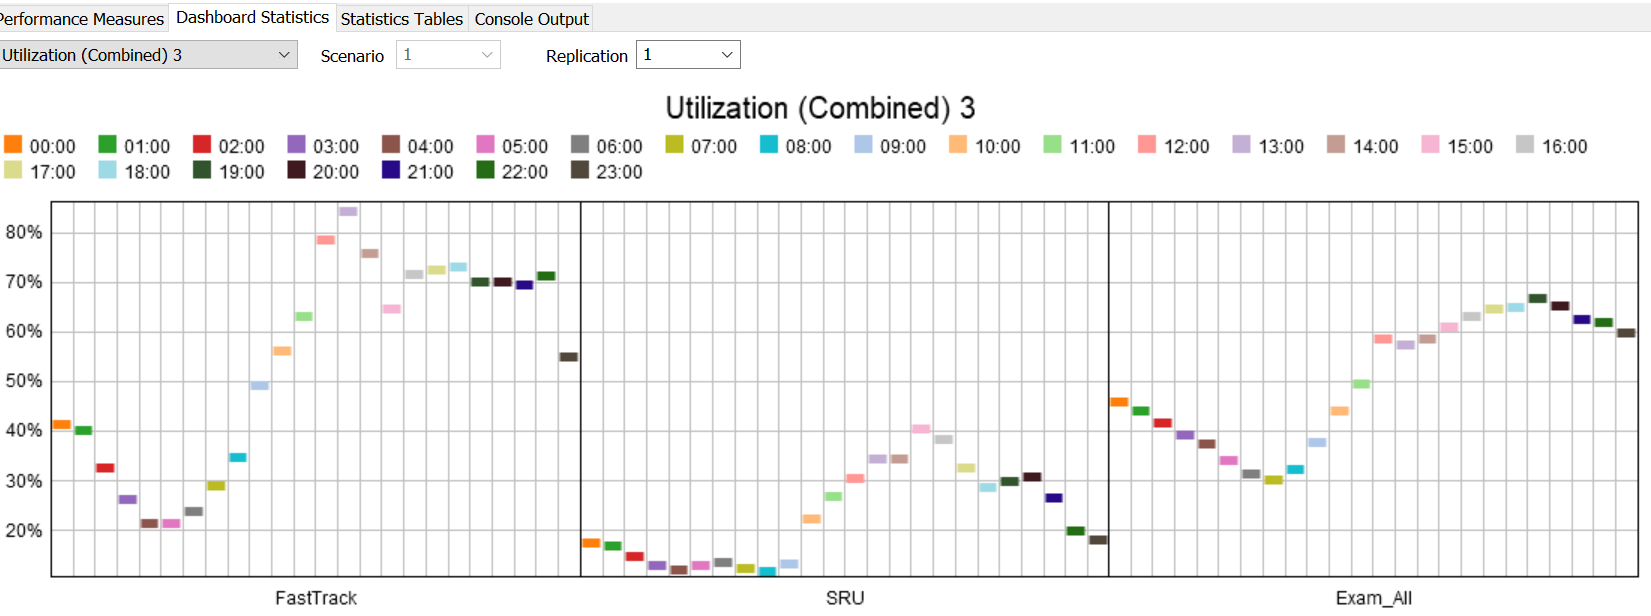
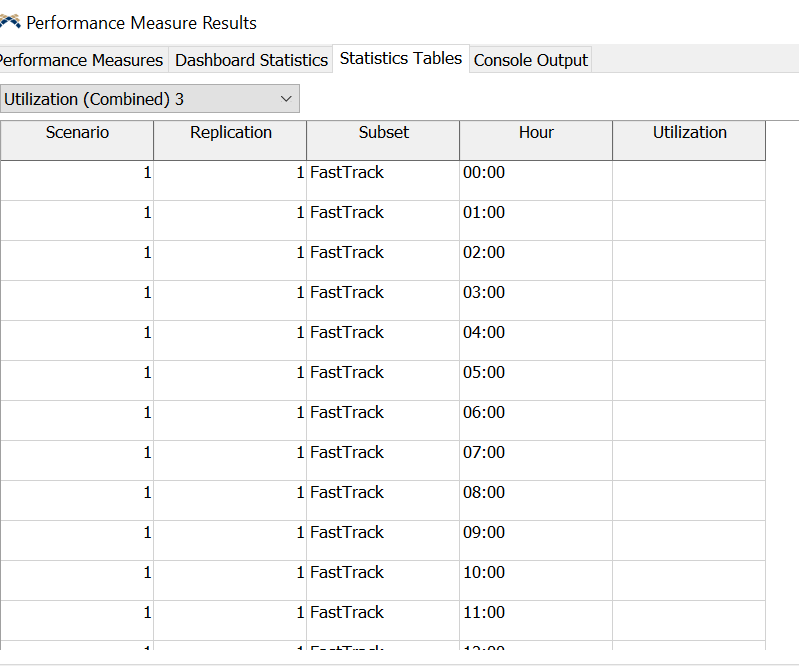
After running multiple replication in experimenter, the dashboard statistics shows the graph of hourly of room utilization. However, the statistics table for this is empty with no utilization rate. I can find the data of census and other data in the statistics table. Only this table is empty. Please let me know if you any suggestion/insight on this. Thanks!


FlexSim 20.2.2
flexsim 20.2.2export dataexperimenter statistics
1599843628057.png (113.3 KiB)
1599843763194.png (42.0 KiB)
· 1
5 |100000

Up to 12 attachments (including images) can be used with a maximum of 23.8 MiB each and 47.7 MiB total.

Ben Wilson avatar image Ben Wilson ♦♦ commented ·

Hi @jun.j2, was jun.j2's or jordan.johnson's answer helpful? If so, please click the red "Accept" button on one of their answers. Or if you still have questions, add a comment and we'll continue the conversation.

If we haven't heard back from you within 3 business days we'll auto-accept an answer, but you can always unaccept and comment back to reopen your question.

0 Likes 0 ·

1 Answer

·
Jordan Johnson avatar image
0 Likes"
Jordan Johnson answered Jordan Johnson commented

That looks like a bug to me. The data for each replication is saved in the tree. The data for the table view is assembled from each of those replication tables. Sometime must be going wrong in that process. I will add this issue to the dev list.

If you post a model, it may be that I could find a work-around for you.

· 6
5 |100000

Up to 12 attachments (including images) can be used with a maximum of 23.8 MiB each and 47.7 MiB total.

Jun J2 avatar image Jun J2 commented ·

@Jordan.Johnson

My file exceeds limit and can't be uploaded. Is there other way to send it to you? I am working on this project now and hopefully you can help on this. Thanks!

0 Likes 0 ·
Jordan Johnson avatar image Jordan Johnson ♦♦ Jun J2 commented ·

You should have a link from Cliff where you can upload your file.

In the mean time, try making a Calculated Table, and writing the following query:

SELECT * FROM [Experiment].[Utilization (Combined) 3]

That may give you the data you need. Note that you can write that query on the Calculations tab, and you'll need to click the "Enable Direct Editing" button. You can run the query by clicking the Update button

0 Likes 0 ·
Cliff King avatar image Cliff King ♦ Jordan Johnson ♦♦ commented ·

@jordan.johnson, I just realized that link only had permission to upload, so you probably couldn't even get it. I just changed the permission to allow "edit" so you should be able to download from the folder now...

0 Likes 0 ·
Jun J2 avatar image Jun J2 commented ·

@Jordan.Johnson

How do I make a calculated table? Is it location below? Thanks!

0 Likes 0 ·
1600103162202.png (45.8 KiB)
Jun J2 avatar image Jun J2 commented ·

@Jordan.Johnson

I found a calculated table below. Should I replace the code under "Query" with

SELECT * FROM [Experiment].[Utilization (Combined) 3]

Thanks!

0 Likes 0 ·
1600103802910.png (67.7 KiB)
Jordan Johnson avatar image Jordan Johnson ♦♦ Jun J2 commented ·

I would make a new Calculated Table. You can add one from the toolbox, and then make it so you can edit the query yourself. Here's a video of how to do it:

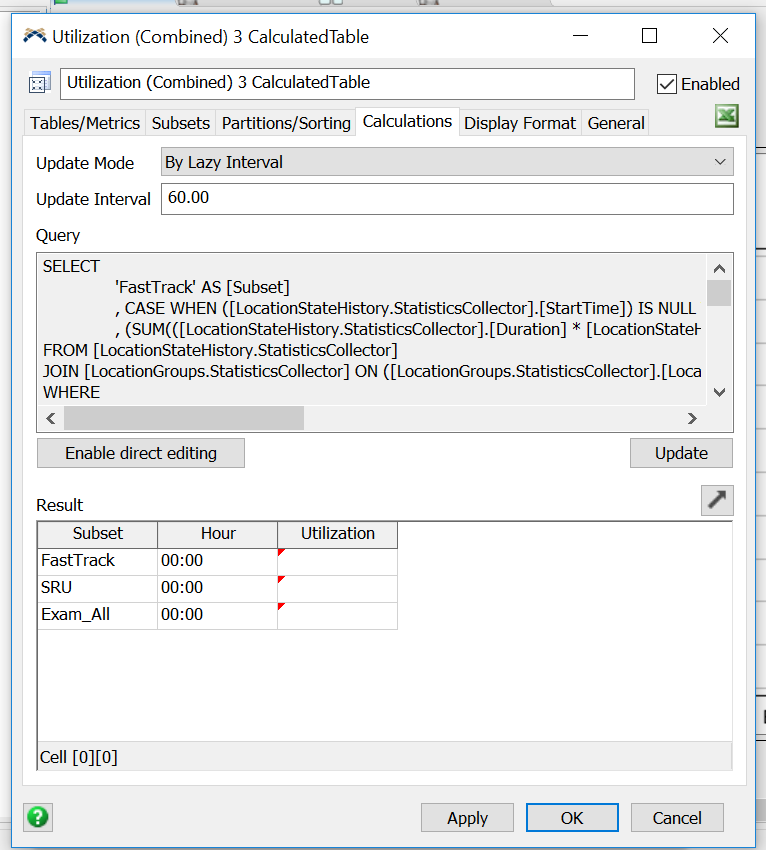
Just follow the same steps in your model. When you're done writing the query, then just click the Update button, and you'll end up with the same table as what you would have seen in the Experimenter, if it weren't for the bug.

After you click Update, you will need to go to the Display tab. In the list of columns, change the Display Format of the Utilization column to Percent. That will make it so that the values in that column appear as percentages.

0 Likes 0 ·

Write an Answer

Hint: Notify or tag a user in this post by typing @username.

Up to 12 attachments (including images) can be used with a maximum of 23.8 MiB each and 47.7 MiB total.