question

SudheerReddy avatar image
0 Likes"
SudheerReddy asked Ben Wilson commented

trying for time plot for work in process token labels

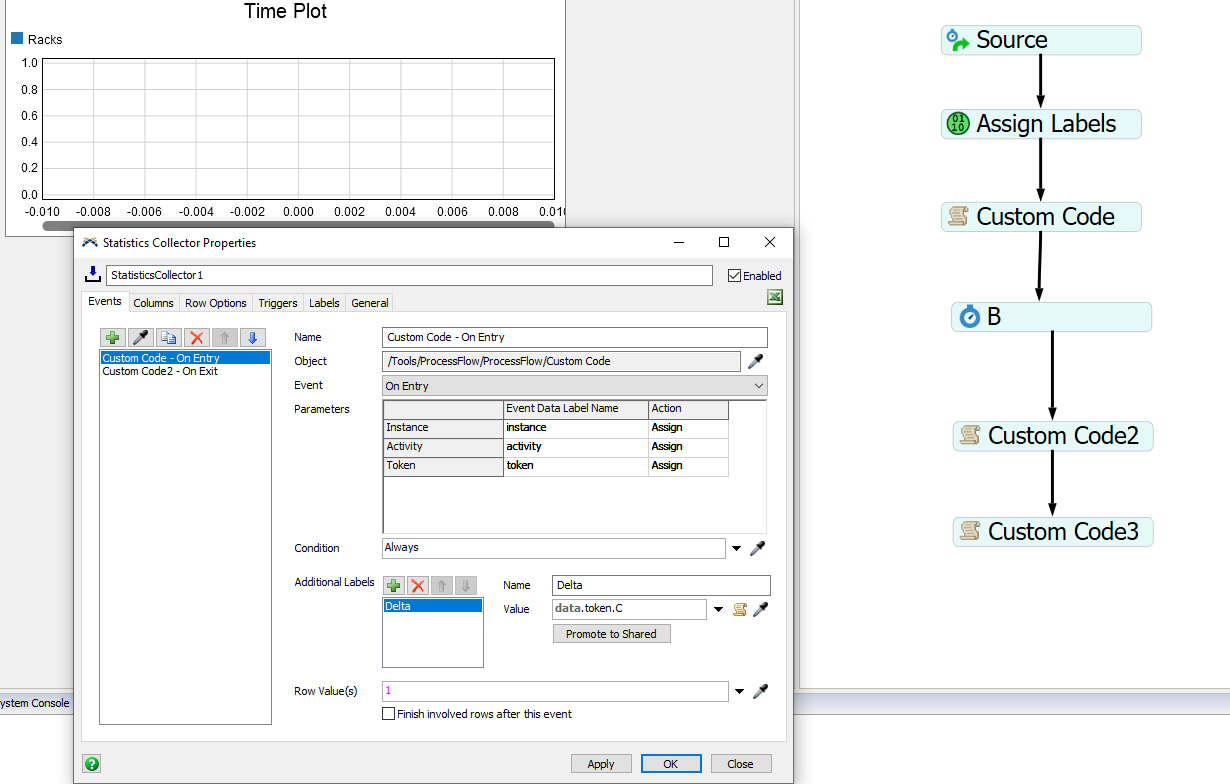
I am trying to capture cumulative value of particular token label i.e. between Custom code - On entry and before Custom Code-2 on Exit.

Every time a token enters Custom code I am trying for time it enters and the cumulative value of particular label and every time a token exists also cumulative value should be updated by subtracting from the total value.

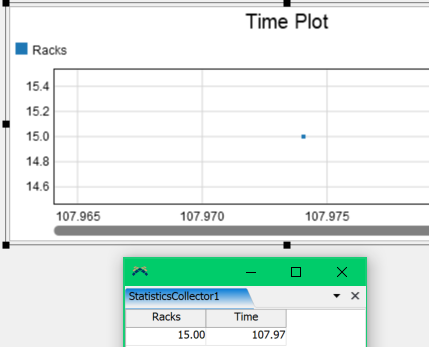
I have successfully updated the time and cumulative value. But not able to achieve the time plot.

stats.fsm


FlexSim 20.1.3
flexsim 20.1.3statistics collector
1614180048501.png (95.3 KiB)
stats.fsm (480.2 KiB)
· 4
5 |100000

Up to 12 attachments (including images) can be used with a maximum of 23.8 MiB each and 47.7 MiB total.

1 Answer

Jeanette F avatar image
0 Likes"
Jeanette F answered Jason Lightfoot commented

Hello @SudheerReddy,

As I was trying to figure out the statistics collector I realized that the zone activities do exactly what you are asking. You can place the enter and exit zone in the places you want to track the current number of tokens and the time plot.

I will attach your model with the zones implemented and the chart.

Zone tracks content vs time.fsm


· 2
5 |100000

Up to 12 attachments (including images) can be used with a maximum of 23.8 MiB each and 47.7 MiB total.