question

Karen Geraldine S avatar image
0 Likes"
Karen Geraldine S asked Jason Lightfoot edited

Showing Blocked State Correctly in Gantt Chart

Hi - tagging @jason.lightfoot since Jason's quite familiar with my simulation.

Question #1

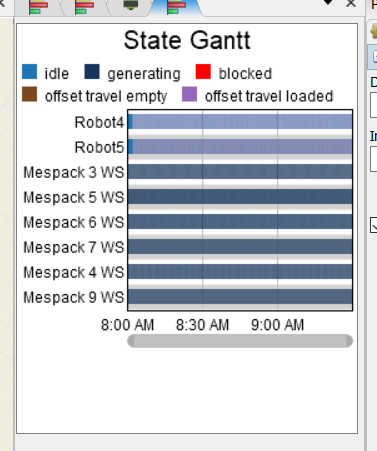
When we put up a State Gantt chart on a dashboard, it's super nice to have a visual understanding - blocked times, clear times, etc.

However, I noticed that the State Gantt only shows as 'blocked' when a processor is 100% blocked (while I wanted it to show that it's blocked starting from the moment a processor is 0.1% blocked, say.)

Is there a possible way to set it like this?

Question #2

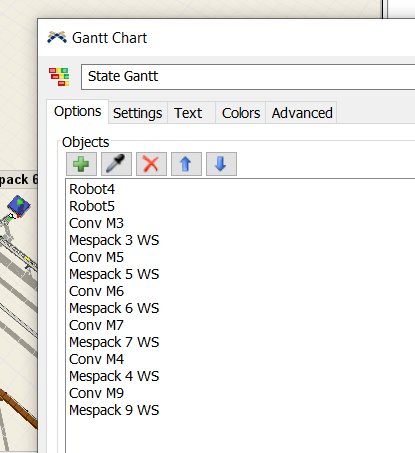
Is it possible to put 'State Gantt' charts of a conveyor (idle, stopped/blocked, etc) to see the conveyor states? Probably would be useful to see when the conveyors are stopped, running, etc. I tried using the eyedropper to add conveyors but it just wouldn't show on the State Gantt. (Shown below)

Thanks in advance!

FlexSim 20.2.3
flexsim 20.2.3gantt chartstate statistics
1614245861704.png (29.2 KiB)
1614245872691.png (45.2 KiB)
1614246034474.png (45.2 KiB)
1614246081001.png (39.6 KiB)
· 1
5 |100000

Up to 12 attachments (including images) can be used with a maximum of 23.8 MiB each and 47.7 MiB total.

Karen Geraldine S avatar image Karen Geraldine S commented ·

Complete - 021721 + ABCDEF Sects - JL - OEE100.fsm

Oh my, I forgot to attach my sim: here is it.

0 Likes 0 ·

1 Answer

·
Jason Lightfoot avatar image
0 Likes"
Jason Lightfoot answered Jason Lightfoot edited

Hi Karen,

I'm not sure I understand what you're saying wrt 01.%blocked. The Gantt shows which states the objects are in over time. At any given instant in time an object is in one state (per profile) as depicted by the Gantt, so when they are blocked they are 100% blocked. It's a bit unclear what you're asking - perhaps you're looking for the State bar chart which will show the percentage time in each state over the whole run.

For a conveyor that may be blocked at one end and free and the other, you might want to consider using photo-eye states if you want a bar chart showing the percentage of the whole runtime in each state. Unfortunately, there seems to be an issue when trying to show PhotoEye states in the state gantt.


5 |100000

Up to 12 attachments (including images) can be used with a maximum of 23.8 MiB each and 47.7 MiB total.

Write an Answer

Hint: Notify or tag a user in this post by typing @username.

Up to 12 attachments (including images) can be used with a maximum of 23.8 MiB each and 47.7 MiB total.