question

Michael D6 avatar image
0 Likes"
Michael D6 asked Felix Möhlmann commented

Output Per Hour

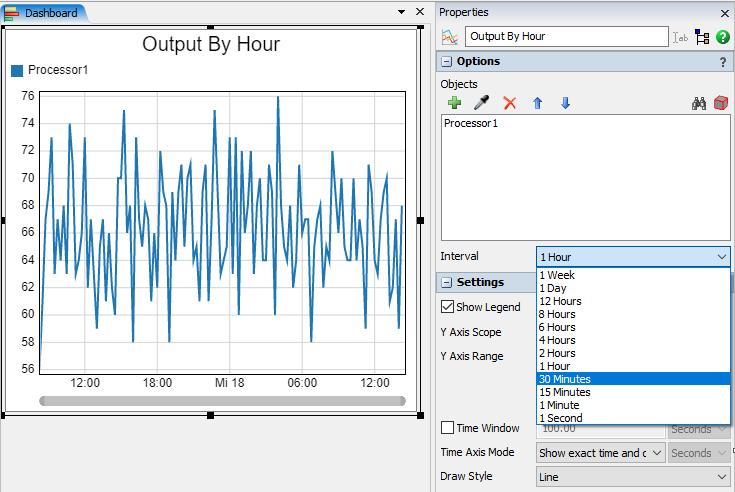
Im sure it is an easy answer. Can someone tell me why the graphic for output per hour doesnt work in this simple model? Processor Stats.fsm

FlexSim 22.1.1
stats
processor-stats.fsm (29.4 KiB)
5 |100000

Up to 12 attachments (including images) can be used with a maximum of 23.8 MiB each and 47.7 MiB total.

1 Answer

·
Jacob W2 avatar image
0 Likes"
Jacob W2 answered Felix Möhlmann commented

Hi @Michael D6,

The reason why your graph isn't populating is because you aren't letting the model run long enough. The output by hour graph will update every 1 hour with the total amount of items, so until you hit one hour of runtime nothing will appear on the chart. Try running your model at a faster speed and see if the graph populates after a bit.

· 2
5 |100000

Up to 12 attachments (including images) can be used with a maximum of 23.8 MiB each and 47.7 MiB total.

Michael D6 avatar image Michael D6 commented ·
@Jacob W2 is there a statistics plot that would show output over a shorter period of time? Thanks for clearing this up.
0 Likes 0 ·
Felix Möhlmann avatar image Felix Möhlmann Michael D6 commented ·

The output by hour chart has an interval setting with options ranging from 1 second to 1 week. I guess the developers decided that "Output by Hour" sounds/reads better than "Output by Time Interval".

1652876067255.png

If you want an interval that is not offered, you can 'install' the chart components and edit the value directly in the statistics collector that becomes accessible that way.

1652876212363.png

1652876238519.png

0 Likes 0 ·
1652876067255.png (63.9 KiB)
1652876212363.png (5.3 KiB)
1652876238519.png (55.8 KiB)

Write an Answer

Hint: Notify or tag a user in this post by typing @username.

Up to 12 attachments (including images) can be used with a maximum of 23.8 MiB each and 47.7 MiB total.