RampUp.fsmHello, I hope everyone is well
I am making a simulation model of a ramp line, and I would like a graph of operator usage, by time (in hours or minutes). Would this be possible?
Thanks in advance!
RampUp.fsmHello, I hope everyone is well
I am making a simulation model of a ramp line, and I would like a graph of operator usage, by time (in hours or minutes). Would this be possible?
Thanks in advance!
Hi Julia
Yes, it's possible to make this type of graph, one option would be to use the dashboards available in flexsim, as shown in the image, I selected the type of dashboard I wanted and then just added the resources I wanted to track. I suggest exploring these dashboard templates a bit more.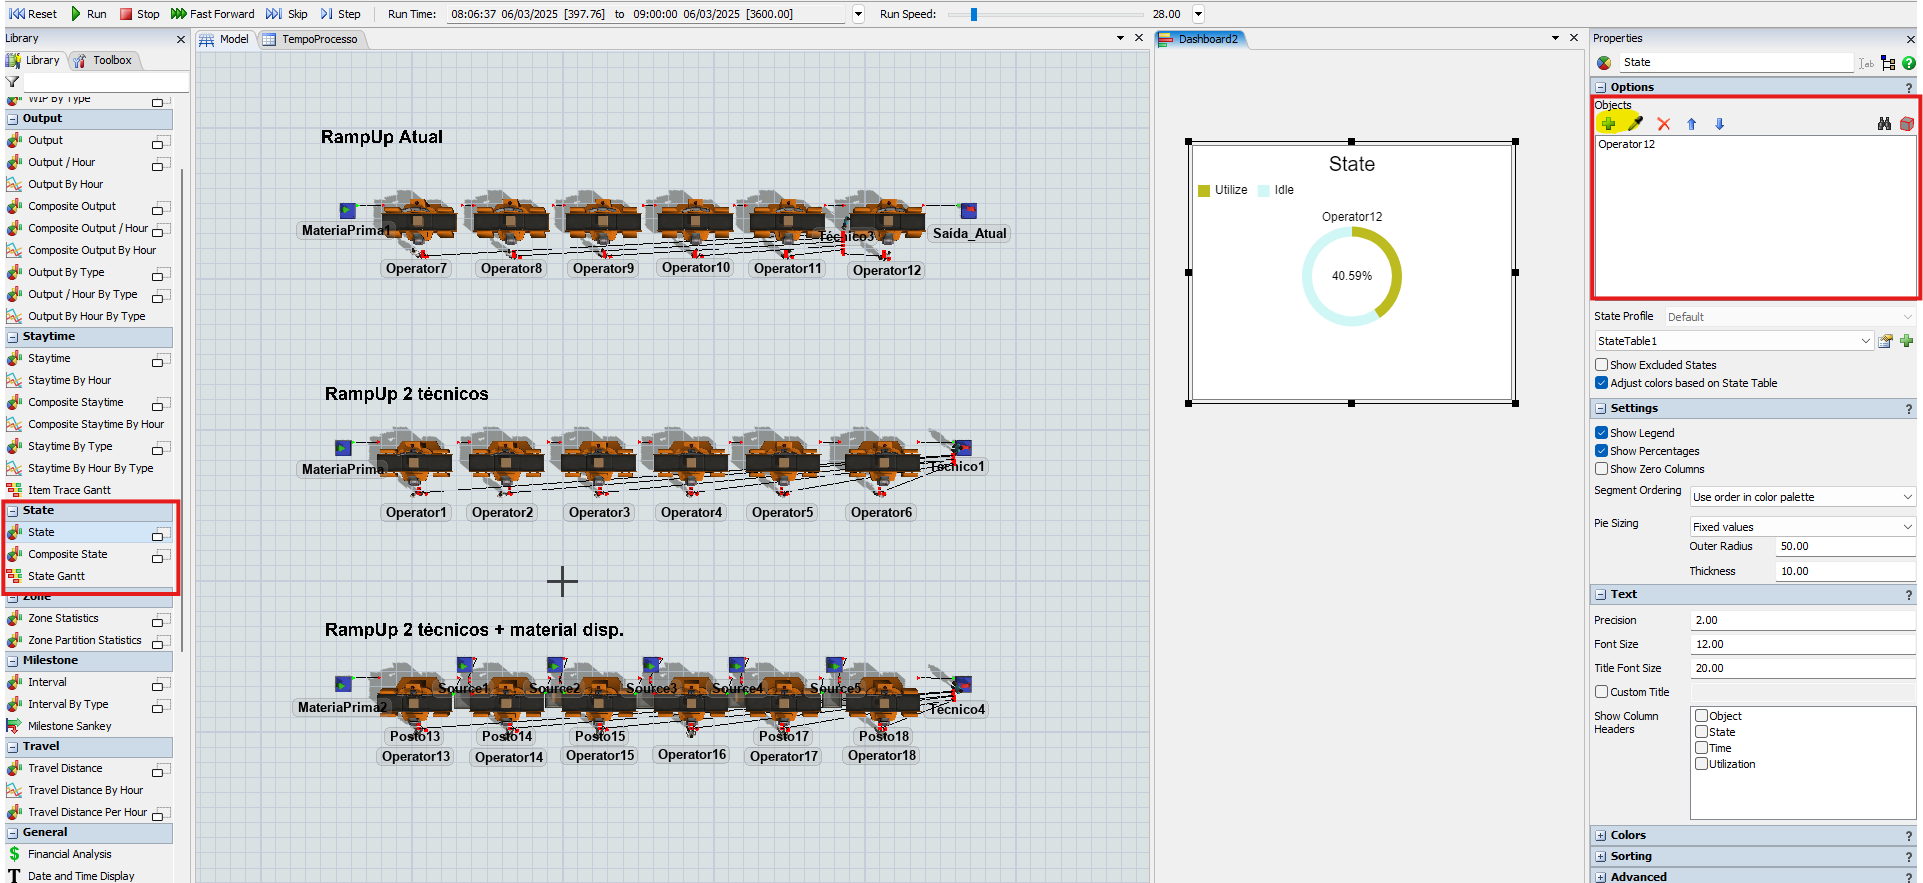
Another efficient way to do this is to use Statistic Collector, so I suggest following up this ticket in which the question is similar to yours and using this tool: https://answers.flexsim.com/questions/138792/cant-find-status-vs-time-for-operator-objects-unde.html
16 People are following this question.
FlexSim can help you understand and improve any system or process. Transform your existing data into accurate predictions.
FlexSim is a fully 3D simulation software environment. FlexSim can be used to simulate any process in any industry.
FlexSim®, FlexSim Healthcare™, Problem Solved.®, the FlexSim logo, the FlexSim X-mark, and the FlexSim Healthcare logo with stylized Caduceus mark are trademarks of FlexSim Software Products, Inc. All rights reserved.
