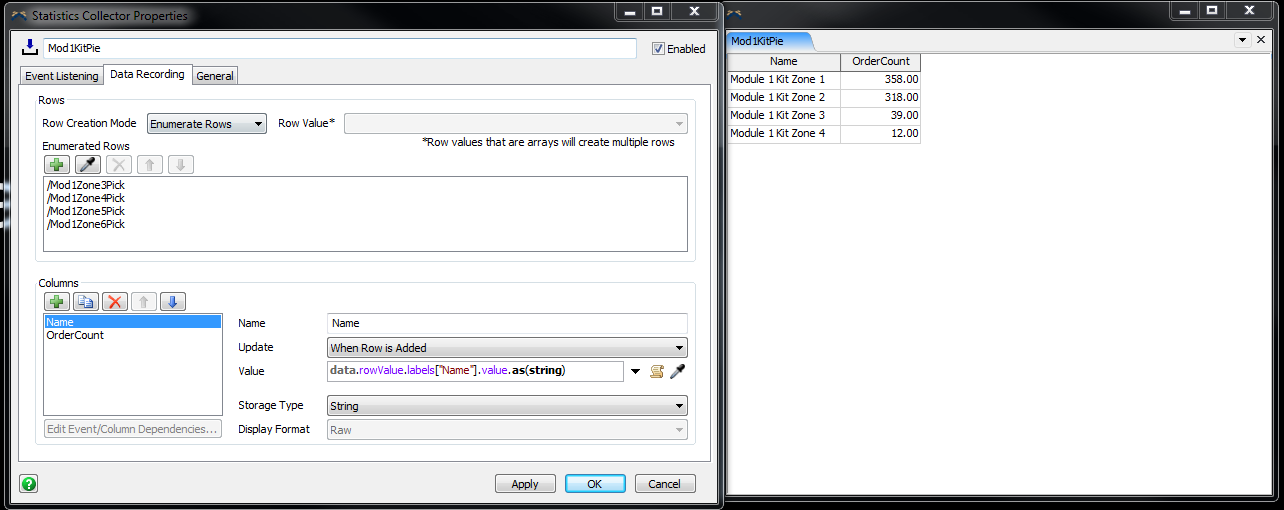
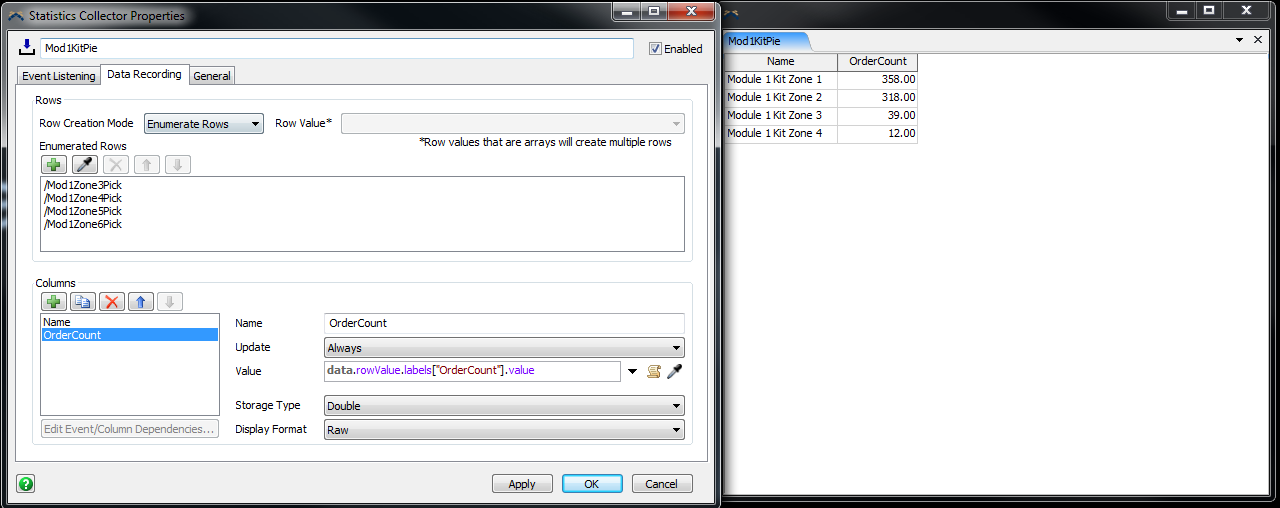
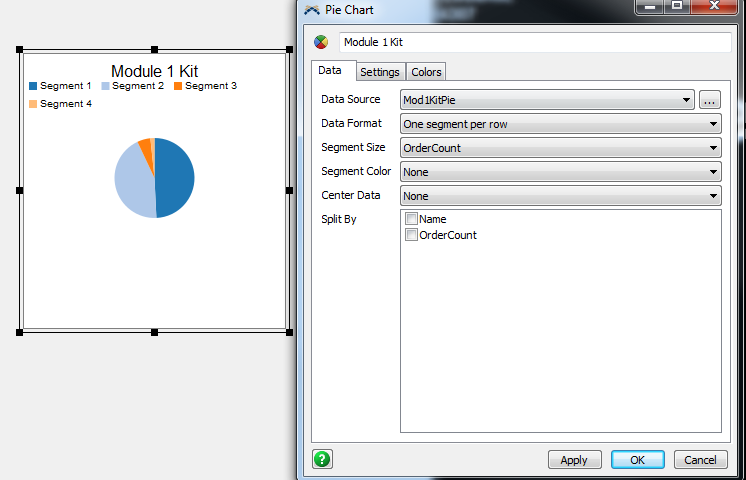
I have (4) photo eyes in my system that are tracking how many boxes pass through different areas of my simulation. I want to display the relative use of each area using a Pie Chart on my dashboard. I created a statistics collector with enumerated rows for each of my PE's and a label with the count and a descriptive name label. I created a Pie Chart but when I ran the simulation the Pie Chart generates a legend with "Segment 1", "Segment 2", "Segment 3", and "Segment 4". Is there some way to overwrite these names so the different parts of the pie chart would have some meaning?
question
Dashboard Pie Chart Change Segment Names
Comment
·
3
Can you upload your model or a partial of it at least so we cna see the setup of your statstics collector?
I can't upload my Model and making a partial model might take a little bit. Attached are screenshots of my statistics collector and pie chart. Is that enough?


Here is a partial model showing the essence of what I am working on. The Pie Chart comes up listing the legend as "Segment 1"... and I don't see any way to control the labels.
partialmodel.fsm
(35.7 KiB)
1 Answer
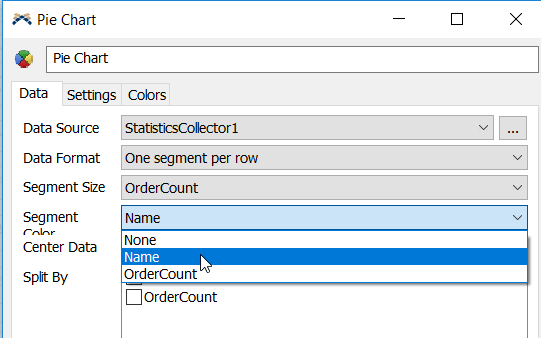
Change segment color option to Name

You can then change the color associate with each name in the Colors tab.
2019-01-18-14-48-12-pie-chart.png
(12.9 KiB)
·
1
question details
11 People are following this question.
