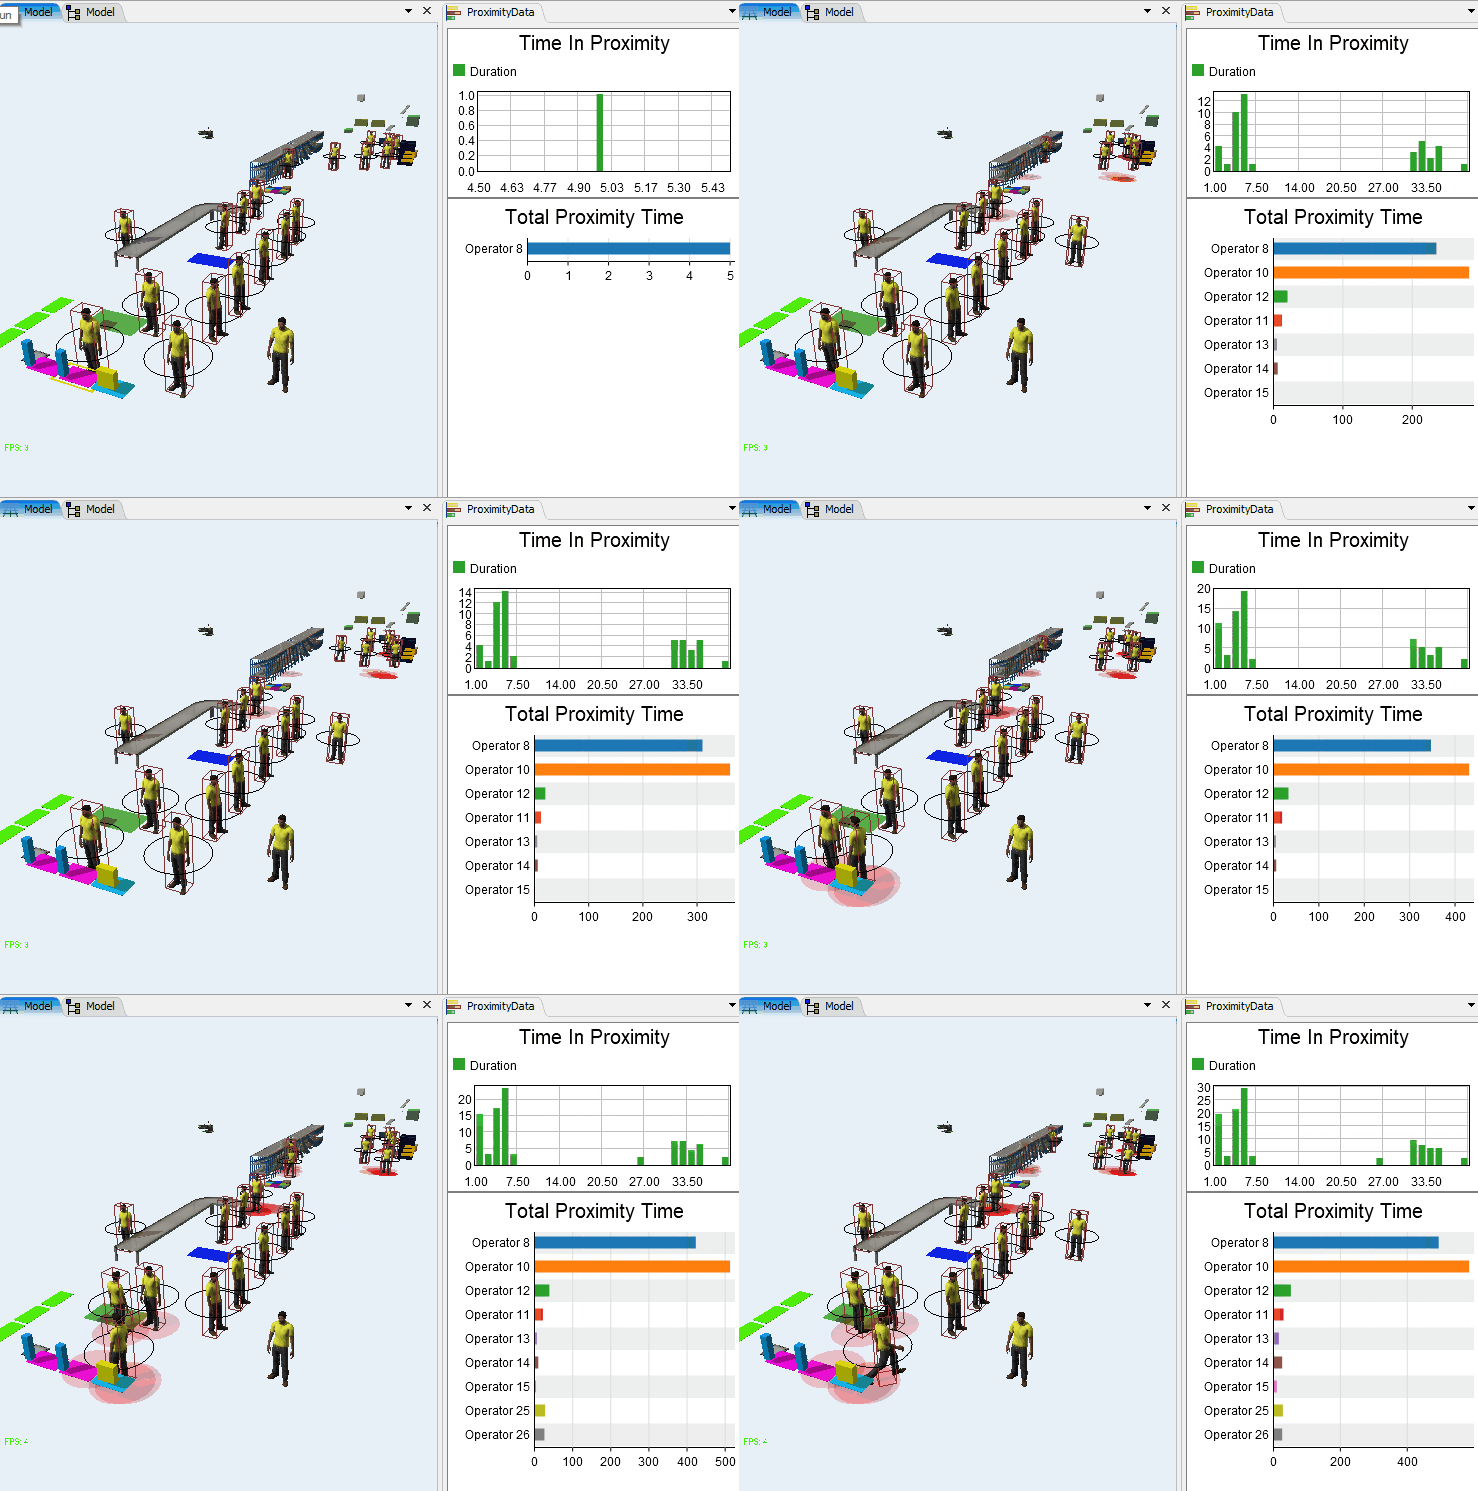
Attached is a sample model that tracks social distancing metrics. I just grabbed one of our testing models, so it's not necessarily eye popping as far as visuals, but the basic concepts of social distancing metric tracking are in there.
This model is implemented in the new 20.2 beta. It uses the new Agent module to detect proximity between objects. I added a proximity system, and added each operator as an agent in the system.
I created an object that draws a "heat map" where proximity points happen. This is a visual tool called "HeatMap" in the model. If you send a message to the object it will add a "hot point" at the location of the sending object. I implemented the object's OnReset, OnMessage, and OnDraw triggers to do this.
Once the heat map is set up, I have the proximity system send a message to the HeatMap from the involved agent object as part of it OnEnterProximity trigger.
Second, I do some statistical tracking using a statistics collector named ProximityTimes. This listens to the agent proximity system's OnEnterProximity and OnExitProximity events, and collects data accordingly. The trickiest part to setting this up was sampling the actual event. For now (hopefully we'll get a better system in the future) you have to sample the event in the tree. In the Events tab of the statistics collector, press the sampler button, then in the tree navigate to the node at MODEL:/ProximitySystem>variables/behaviors/Proximity Behavior and hover the cursor over it to get the list of events.
The ProximityTimes statistics collector collects individual times. This allowed me to add the "Time In Proximity" dashboard chart. For the other charts, I needed a calculated table to aggregate the values. The ProximityAggregates table aggregates the data needed for the other three dashboard charts: Total Proximity Time, Proximity Count, and Average Time In Proximity.

