question

Steven Hamoen avatar image
0 Likes"
Steven Hamoen asked Jordan Johnson commented

Bug report Multilocation state graph

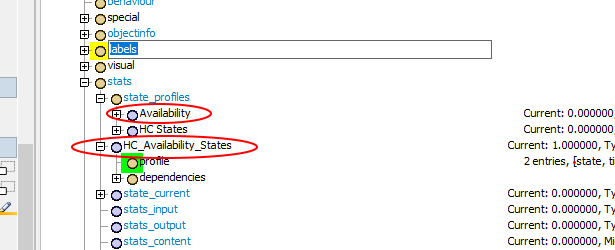
If you create a few multilocation objects (chairs and tables in my case) put them toghether in a group, then drag a state graph template from the library onto a dashboard there is no way to show the graph, despite the state profile you choose. If you look in the tree you will see that the HC states are filled but they are not shown. The Availibility profile is present 2 times, one filled, the other not. See attached model for reproduction

MultiLocationStateGraphBug.fsm

I've also tried to create a state pie of an individual object via the pin on the statistics part of the properties but that doesn't work either, nothing is shown and if you look in the statistics part of the properties it shows the availability profile but if you look at the statistics collector it shows that it looks the default profile. But for People objects it looks like there is no default profile?

FlexSim 21.1.0
flexsim 21.1.0
5 |100000

Up to 12 attachments (including images) can be used with a maximum of 23.8 MiB each and 47.7 MiB total.

1 Answer

·
Jordan Johnson avatar image
0 Likes"
Jordan Johnson answered Jordan Johnson commented

If you want to see the HC states (availability and/or location states), then you can use a Location State chart. You can then choose options to see all members of the group individually, or averaged together as a whole.

I didn't see two availability profiles; I did see that there is a profile called Availability, and another called HC_states_availability; the second is a combined profile that shows all combinations of states between the HC States profile and the Availability profile.

The standard charts are not currently designed to work with HC/People objects.

· 2
5 |100000

Up to 12 attachments (including images) can be used with a maximum of 23.8 MiB each and 47.7 MiB total.

Steven Hamoen avatar image Steven Hamoen commented ·

@Jordan Johnson Thanks for replying, at least I have a solution for showing the State pies

But if the standard charts don't work, shouldn't the pins be changed to work with the non standard charts?

Concerning the 2 profiles (see picture below) I see 2 availability profiles but is the HC_ a combined one?

1 Like 1 ·
Jordan Johnson avatar image Jordan Johnson ♦♦ commented ·

We are changing the pin buttons; they are not very consistent right now. I think your suggestion about detecting if you are pinning an HC object is a good idea, I'll see what we can do about that as we re-do the pin buttons.

Yes, the HC_Availability_States is the combined profile. If you look at the profile node itself, you can see that it has combinations of states, such as Idle_Available (one state from the HC States profile and one from the Availability profile).

0 Likes 0 ·

Write an Answer

Hint: Notify or tag a user in this post by typing @username.

Up to 12 attachments (including images) can be used with a maximum of 23.8 MiB each and 47.7 MiB total.