Hi,
I would like to use empirical distribution for my delay time. I have uploaded a table as global table with 2 columns. The first column contains the percentage and the second column contains the number of items. However, the graph shown by dempirical distribution seems off.
Would like to know if im using dempirical distribution the right way. Have attached the screenshot of my global table and the graph demipirical is showing.
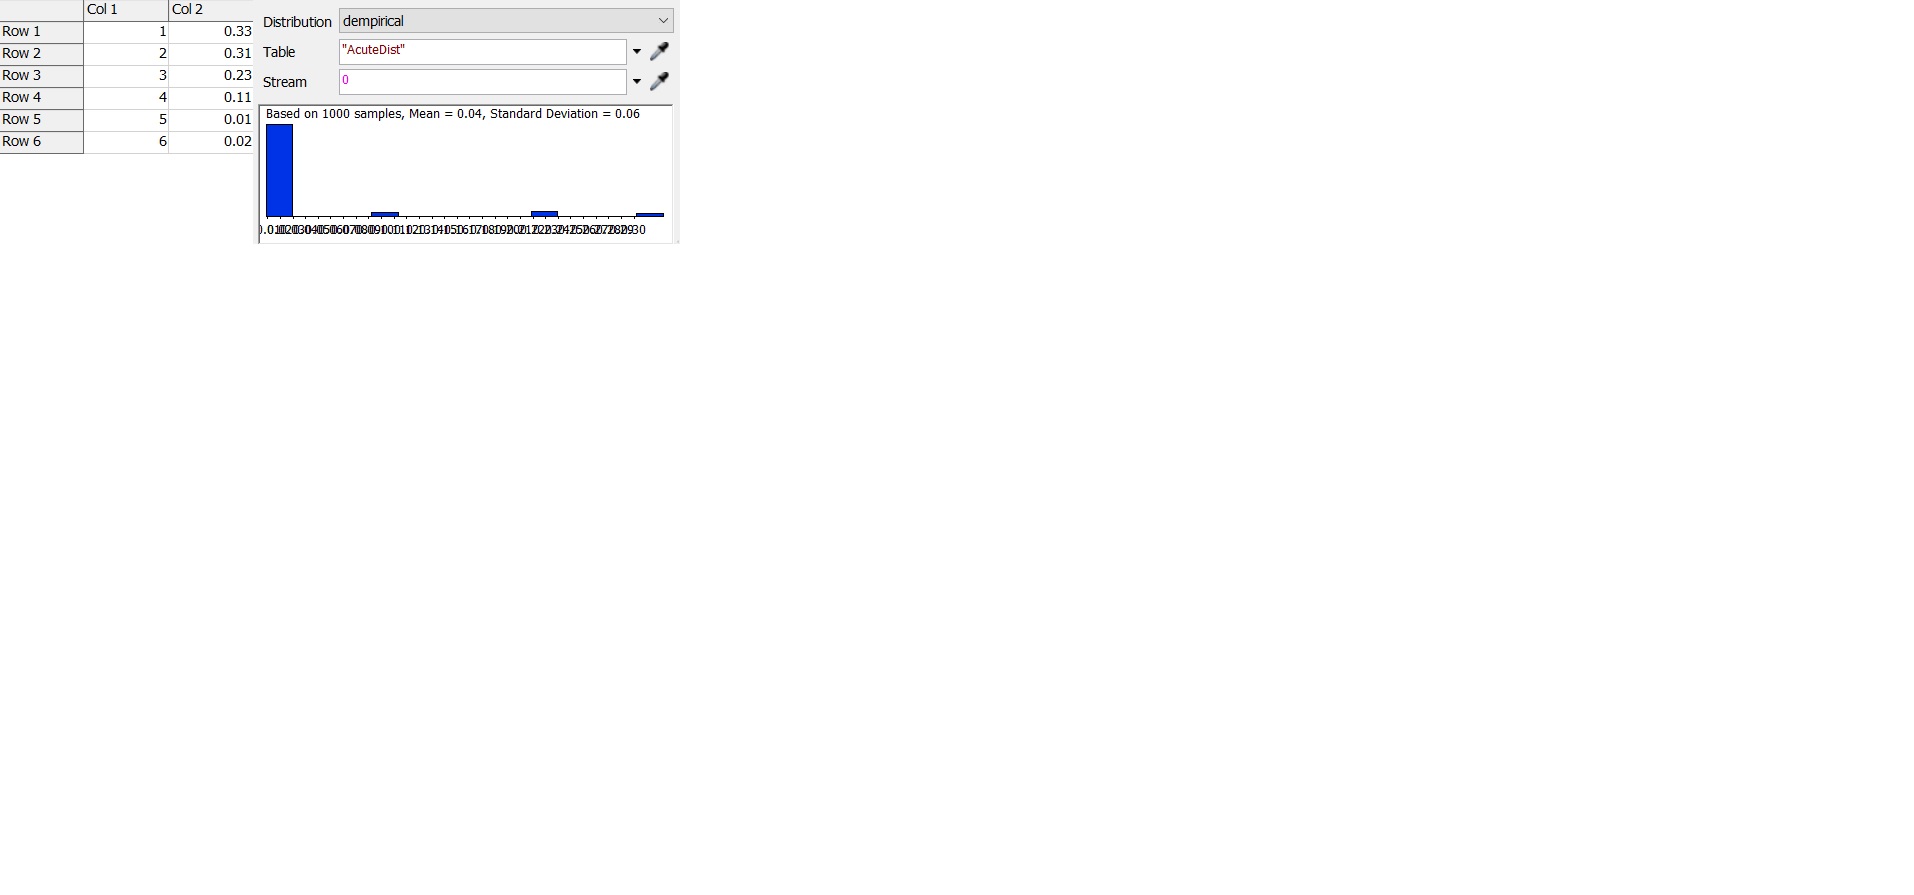
 Thank you.
Hi @Lenny C, was Jörg Vogel's answer helpful? If so, please click the red "Accept" button at the bottom of their answer. Or if you still have questions, add a comment and we'll continue the conversation.
If we haven't heard back from you within 3 business days we'll auto-accept an answer, but you can always unaccept and comment back to reopen your question.
Answer by Craig DIckson ·
To clarify what Jorg quoted, you need to change two things in your table:
Hope that helps.
Answer by Jörg Vogel ·
From the documentation for dempirical():
The table referenced must contain a list of values and probability percentages associated with each of the values. Probability percentages must be entered in column 1 starting with row 1 of the table, and their associated values are entered in column 2. The table may have as many rows as needed to define as many values as desired. The percents are entered as numbers between 0 and 100, and should add up to a total of 100 percent; otherwise any values defined after a cumulative percentage of 100 is reached will never be returned.
Please swap the columns.
© 1993- FlexSim Software Products, Inc. All Rights Reserved.
FlexSim is a fully 3D simulation software environment. FlexSim can be used to simulate any process in any industry.
FlexSim®, FlexSim Healthcare™, Problem Solved.®, the FlexSim logo, the FlexSim X-mark, and the FlexSim Healthcare logo with stylized Caduceus mark are trademarks of FlexSim Software Products, Inc. All rights reserved.