Hi, im trying to track the staytime of a patient in various waiting areas in sub process flows by using Zones. Even though the zone has statistics, they are not displayed on the dashboard, as seen below. May I know how I can go about fixing this? Thank you!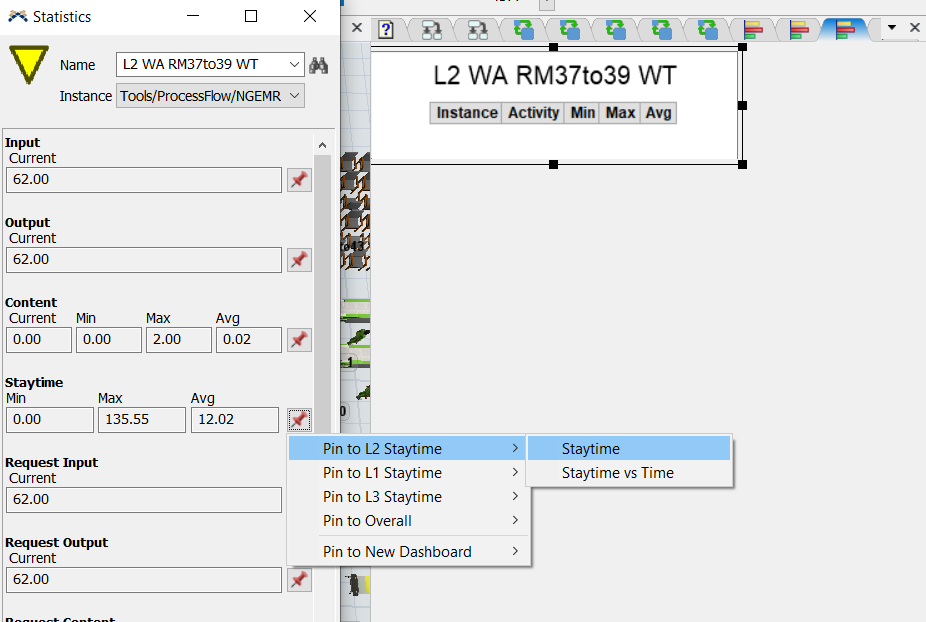
Dashboard not showing statistics
FlexSim 20.1.3
Here is a little about what's going on. You have two subflows (Acute and Chronic), and it looks like you're trying to get stats on both of those. Unfortunately, stats collectors made by the pin buttons don't really work on activites in subflows. The pin buttons need to be updated, which is a current issue on the dev list.
The pin buttons work by creating a stats collector in your model, in the toolbox, and then creating a chart that draws the data in that stats collector. To fix your issue, you need to fix the stats collectors, so that they make a table, which will make the charts draw correctly.
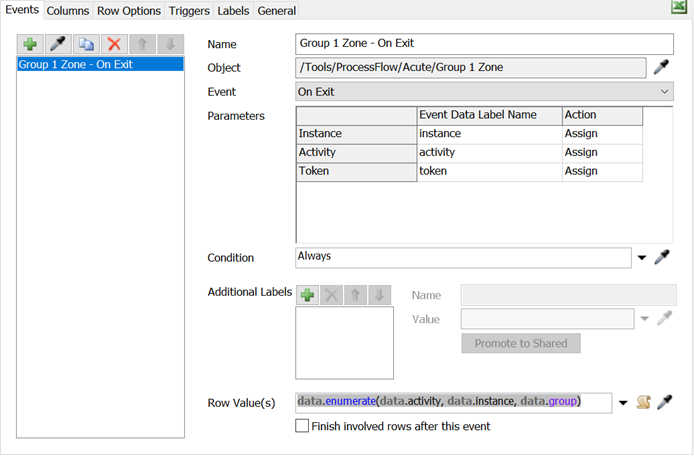
Some of the stats collectors create tables that show the min, max and average of the staytime. To fix those stats collectors, double-click on them in the toolbox, and delete the Enumerate event. Use the sampler to sample the Zone and choose On Exit. Then, for the row value, use this code:
- data.enumerate(data.activity, data.instance, data.group)
The event configuration should look like this:
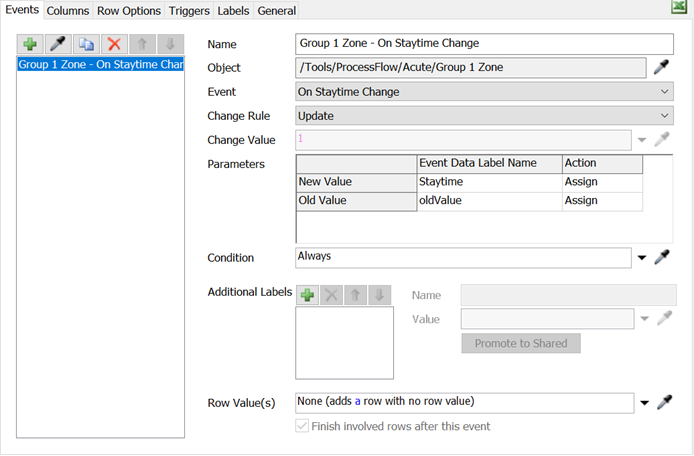
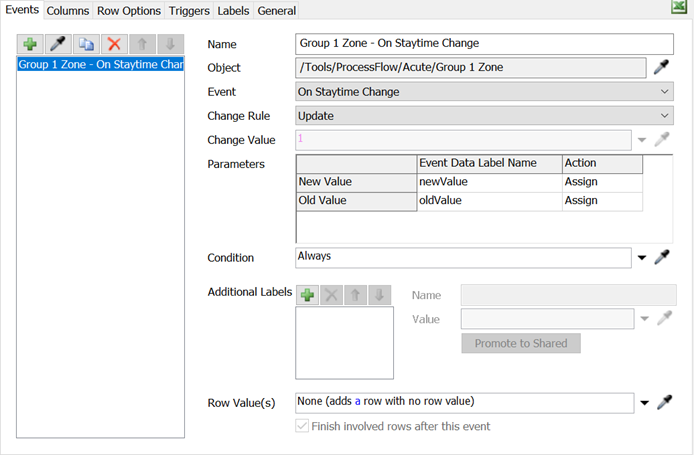
Other stats collectors are supposed to draw a time plot of staytime vs time. It looks like there is a bug in those. However, the steps to fix them are pretty much them same. You'll need to delete the first event, and then re-sample the zone, and choose On Staytime Change, and set the new value's label name to Staytime. The configuration should look like this:
I tried this change on the first two stats collectors in the list and it worked. Note that the charts will be empty until the model generates some data, so you'll need to run until tokens move through those flows.
14 People are following this question.
