question

Maryam H2 avatar image
0 Likes"
Maryam H2 asked Maryam H2 commented

Showing the multi-location group state (%) and throughput in the 3D model

Hi,

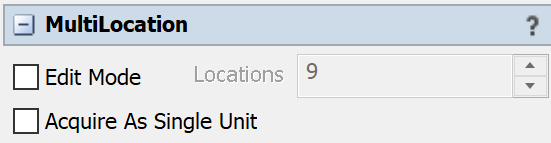
I am trying to show the state of a multi-location group as a percentage on my 3D model. For example, I have several waiting areas (all in one location group) and want to show the throughput or percentage of the utilization in my 3D model.

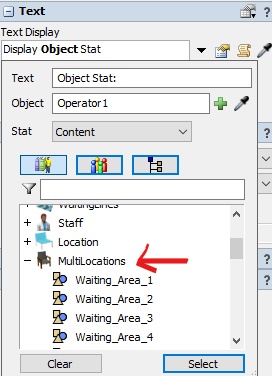
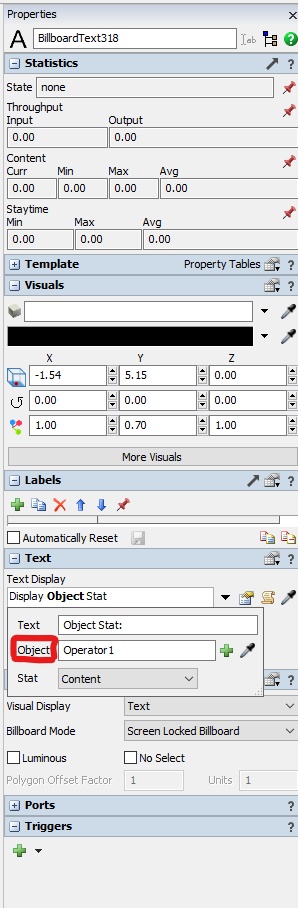
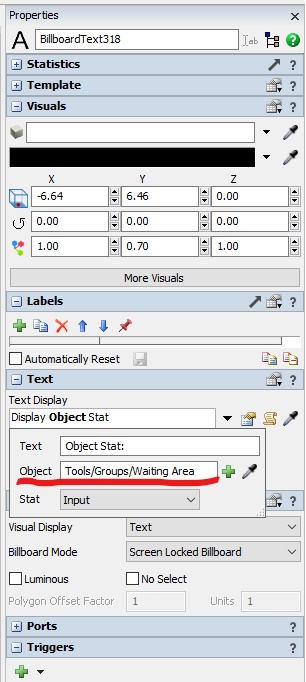
1- When I create a text/billboard text, it doesn't allow me to sample the group in the "object" section, but each of the objects in a group. If I sample the location group through a toolbox, it shows a crazy big number as an object statistics.

1632157030667.jpeg

2- For the state percentage, the state doesn't change from "idle" to something else such as "busy" or "utilize". Also, the same problem as anove, I cannot report on the location group state, just a single object in each group, and it doesn't even update the numbers as I run the model. Is it possible to show the state of a location group as % on the 3D model?

1632157094868.jpeg

Thanks!

FlexSim 21.2.2
healthcarethroughputvisual textmultilocationtext display
1632157030667.jpeg (958.9 KiB)
1632157094868.jpeg (935.9 KiB)
5 |100000

Up to 12 attachments (including images) can be used with a maximum of 23.8 MiB each and 47.7 MiB total.

1 Answer

·
Jeanette F avatar image
0 Likes"
Jeanette F answered Maryam H2 commented

Hello @Maryam H2,

People objects do not use standard object statistics. The billboard is trying to reference these standard object statistics, so that is why they are not showing correctly. There are some people objects that happen to use some standard objects statistics but that is not the standard in the HC environment. Please use people statistic tables and charts to gather and display your statistics.

On a side note for the multilocation waiting area, you can idividually select objects within it when the edit mode is selected. So if you unselect this you should be able to select the multilocation as a whole.1632170180891.png


1632170180891.png (9.2 KiB)
· 3
5 |100000

Up to 12 attachments (including images) can be used with a maximum of 23.8 MiB each and 47.7 MiB total.

Maryam H2 avatar image Maryam H2 commented ·

Thanks! I see for the multilocation The "Edit Mode" is unselected. But I cannot show the multilocation statistics using visual texts. I cannot select the multilocation as a whole, it just allows me to choose one of the objects under this group:

Do you mean it's not possible in the HC environment?

screenshot-180-li.jpg

0 Likes 0 ·
screenshot-180-li.jpg (862.4 KiB)
Jeanette F avatar image Jeanette F ♦♦ Maryam H2 commented ·

It is possible, using people specific statistic collectors, charts, and plots.

However, a billboard does not seem to be supported in the Health Care environment because the Health Care environment does statistics differently.

0 Likes 0 ·
Maryam H2 avatar image Maryam H2 Jeanette F ♦♦ commented ·
Got it, thanks!
0 Likes 0 ·

Write an Answer

Hint: Notify or tag a user in this post by typing @username.

Up to 12 attachments (including images) can be used with a maximum of 23.8 MiB each and 47.7 MiB total.