question

Steven Chen avatar image
0 Likes"
Steven Chen asked Steven Chen commented

How to show both percentages and numbers in a chart

Hi everyone,

As titled, I would like to compute the storage rate of one rack by using the Statistics Collector functionality. Besides, a dashboard chart would show the data calculated, such as the utilisation-rate percentage and the number of items stored in the rack.

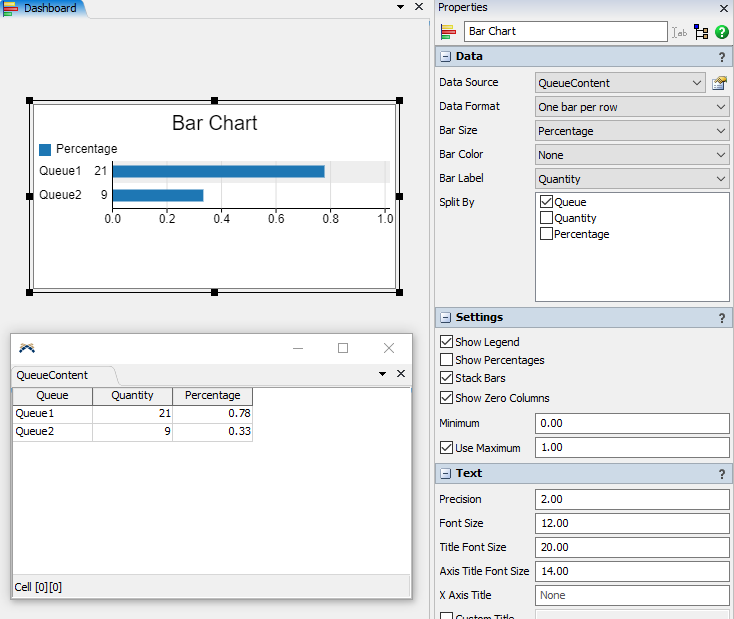
To achieve the goal, I have made an effort to design the display with options in its setting. However, it seems that the dashboard cannot show the two kinds of information (the utilisation rate and the number of stored items) at the same time.

I desire to know whether or not there is a possibility of illustrating the two data types in a single chart.

Thank you for your time


FlexSim 22.0.1
statistics collectordashboard chart
5 |100000

Up to 12 attachments (including images) can be used with a maximum of 23.8 MiB each and 47.7 MiB total.

1 Answer

·
Felix Möhlmann avatar image
0 Likes"
Felix Möhlmann answered Steven Chen commented

You could set up the statistics collector that feeds the chart to contain both the total amount as well as the percentage value. Then use one to determine the bar size and display one as label in front of the bar.

1646984231917.png

CustomChart.fsm


1646984231917.png (48.3 KiB)
customchart.fsm (33.8 KiB)
· 1
5 |100000

Up to 12 attachments (including images) can be used with a maximum of 23.8 MiB each and 47.7 MiB total.

Steven Chen avatar image Steven Chen commented ·
Hello, Felix, thank you for your advice. The solution you proposed helps me very much.
0 Likes 0 ·

Write an Answer

Hint: Notify or tag a user in this post by typing @username.

Up to 12 attachments (including images) can be used with a maximum of 23.8 MiB each and 47.7 MiB total.