question

Aaron Stanton avatar image
0 Likes"
Aaron Stanton asked Aaron Stanton commented

Source by hour from empirical data

I have developed a simple ER sim and would like to establish the arrival of patients based on data from our EMR.

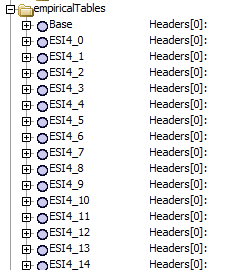
The table below represents 1 months worth of arrivals by ESI level by time of day. ( am just focusing on 5 and 4 right now.

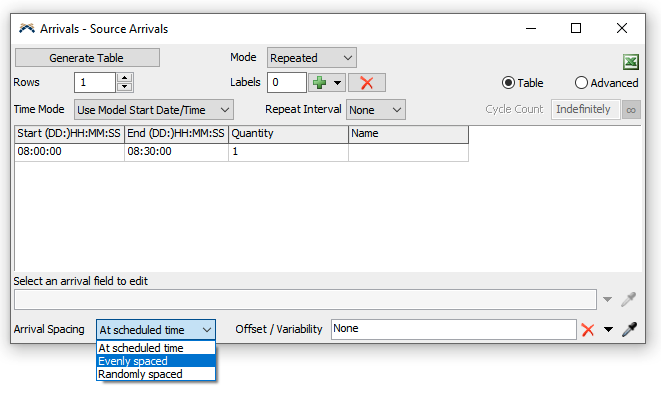
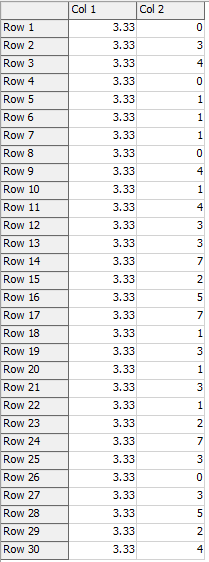
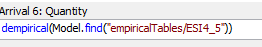
I want to use this data to establish the quantity of patients that arrive per hour by ESI level however I am struggling to apply it to one day at a time. for example it keeps trying to have 26 patients arrive at 1am with ESI of 4 instead of just 1 or 2.

I am very new to flex sim so let me know if other screen shots would be helpful.

Thanks, Aaron

Time ESI 5 ESI 4 ESI 3 ESI 2 ESI 1
0:00:00 0 31 39 17 6
1:00:00 5 26 35 23 4
2:00:00 3 14 36 19 5
3:00:00 3 15 25 15 2
4:00:00 3 11 27 11 2
5:00:00 4 16 27 13 3
6:00:00 1 16 28 11 4
7:00:00 3 44 41 28 6
8:00:00 6 81 75 30 6
9:00:00 1 80 86 44 9
10:00:00 8 89 83 73 12
11:00:00 3 72 97 50 7
12:00:00 7 81 94 60 9
13:00:00 5 93 104 47 5
14:00:00 7 68 92 45 4
15:00:00 3 62 98 40 5
16:00:00 8 86 78 57 5
17:00:00 4 104 88 44 3
18:00:00 2 97 75 43 4
19:00:00 6 64 84 50 8
20:00:00 5 61 74 28 7
21:00:00 10 48 74 19 6
22:00:00 5 45 47 28 4
23:00:00 0 0 0 0 0


FlexSim 22.0.1
source scheduleempirical distribution
· 2
5 |100000

Up to 12 attachments (including images) can be used with a maximum of 23.8 MiB each and 47.7 MiB total.

Jeanette F avatar image Jeanette F ♦♦ commented ·

Hi @Aaron Stanton,

It's hard to know how to help without looking at your model. To receive a more accurate solution, please post your model or a sample model that demonstrates your question.

Proprietary models can be posted as a private question visible only to FlexSim U.S. support staff. You can also contact your local FlexSim distributor for phone or email help.

0 Likes 0 ·
Aaron Stanton avatar image Aaron Stanton Jeanette F ♦♦ commented ·

I have attached the file.

What I am trying to figure out is how to use the real statistical data to determine how many petient arrive an hour by hour of the day.


ER Registration-Triage.fsm

0 Likes 0 ·

1 Answer

·
Felix Möhlmann avatar image
1 Like"
Felix Möhlmann answered Aaron Stanton commented

The "Arrival Spacing" option at the bottom of the schedule settings allows you to change between all patients arriving on the hour or spacing them out evenly or randomly inside the allotted time window.

1647452901177.png


1647452901177.png (31.2 KiB)
· 4
5 |100000

Up to 12 attachments (including images) can be used with a maximum of 23.8 MiB each and 47.7 MiB total.

Aaron Stanton avatar image Aaron Stanton commented ·
What I am trying to do is determine the correct quantity of patients arriving per hour based on old arrival patterns per the spread sheet originally shared.
0 Likes 0 ·
Joerg Vogel avatar image Joerg Vogel Aaron Stanton commented ·

yes @Aaron Stanton , that is obvious. And if you realize @Felix Möhlmann approach, you would get an statistical distributed arrival pattern based on your data. It is only a matter of a transferring your data manually into this property window. Or if you start with two or three rows inserting your data, you can find your entries in model tree and accomplish copying you data by copy and paste in a table view of treenodes. You can try also the excel icon to get a view to an import tool for excel files.
Evenly spaced is for an time interval of one hour a quite accurate arrival pattern. All you must accomplish is inserting more rows in the table. You find an edit field called Rows to do so.

0 Likes 0 ·
Felix Möhlmann avatar image Felix Möhlmann Aaron Stanton commented ·

Sorry, I seem to have missed the fact that this is monthly data that you want to break down to daily arrivals. I have two suggestions for this.

The first is to simply use the average. Divide the numbers by 30 (let's assume there are 30 days in each month). This will likely give you a decimal number like 2.438. What you could do now is take the whole number part as a base for the arrival quantity. The rest gets compared against a random number between 0 and 1. If the random number is smaller, 1 gets added to the arrivals. So the 2.438 would result in 3 arrivals 43.8% of the time and 2 arrivals for the remaining 56.2%. The drawback of this is of course that there are only ever two possible values for a time slot. The code to do this calculation in a single row is shown below. It assumes that the monthly data is entered into a global table named "ESI4" correspondingly.

Math.trunc(Table("ESI4")[12][1]/30) + (Math.frac(Table("ESI4")[12][1]/30) > uniform(0,1,getstream(model())) ? 1:0) 

To get more variance you could use empirical distributions. Since the numbers vary between the time of time, you will need a distribution for each combination of time slot and ESI value. Setting these up in the toolbox would be a lot of work, so I'd suggest to use the "dempirical()" command.

https://docs.flexsim.com/en/22.1/Reference/CodingInFlexSim/CommandReference/Commands.html#cempirical

The setup of the necessary tables can be automated. In the attached file I wrote some code in the skript window which will do this. I also created a new node "empiricalTables" in the model tree, that will hold all other tables as subnodes. The first subnodes is the base table consisting of 30 rows. This node gets copied to create the individual tables for the time slots. To fill it in, I distribute the number of patients that arrived in one month over the 30 rows (days) of the table by incrementing a random row by 1 as many times as there are patients. This results in a wider spread of possibles values than the method above.

1647626669268.pngThe values in the first column are the percentage chances of the rows to get chosen. They all have the same 100/30 chance in this case.

Once the tables are generated you can use them in the source by referencing the respective nodes by name inside the "dempirical()" command.

1647626762587.png

1647626744897.png

er-registration-triage_fm.fsm

0 Likes 0 ·
Aaron Stanton avatar image Aaron Stanton commented ·

Wow. I have alot of learning to do.

About a quarter of what you said made sense. Not because you didn't explain it well but because it is so over my head.

I tried dividing by 30 and that sort of works on the hours where there are more than 30 patient arrivals in a month.

Another thought I had that matched my skill level was to calculate the Min, Max and Mode of each arrival set per hour and use a triangular distribution with those parameters per hour. It would be some setup in excel and then manual entry into Flex sim but should get me close.

Thanks everyone for the responses.


0 Likes 0 ·

Write an Answer

Hint: Notify or tag a user in this post by typing @username.

Up to 12 attachments (including images) can be used with a maximum of 23.8 MiB each and 47.7 MiB total.