question

Douwe Jd avatar image
0 Likes"
Douwe Jd asked Jacob W2 answered

issues with basic tutorial 1.3 step 5 with version 22.1.1

In this step, as well as with steps in tutorial 1.2, I ran into some issues with following the guidelines of the tutorials. I realize that the new version works a little different than what is explained in the tutorial steps.

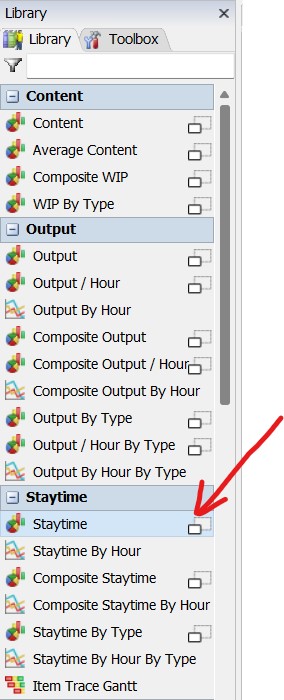
The main issue with this difference for me is how the statistics collector works. I read in previous comments that I need to 'install' this manually now to get the statistics collector in my toolbox when I pin a chart to the dashboard. However, when I have to change things in the properties window, as in step 5 of tutorial 1.3, the settings I find are also completely different (and also look more complicated than the tutorials). The same counts for property settings of the charts themselves, where some options in the 'Data' tab seem to be absent. Since I think that getting the graphs on my dashboard right and understanding how the statistics collector works, I really want to understand how to complete these basic tutorials with the new version. Could i get guidelines for step 5 of tutorial 1.3 for the new version?


FlexSim 22.1.1
tutorials
5 |100000

Up to 12 attachments (including images) can be used with a maximum of 23.8 MiB each and 47.7 MiB total.

1 Answer

·
Jacob W2 avatar image
0 Likes"
Jacob W2 answered

Hi @Douwe Jd

In the more recent versions of FlexSim much of the data collection that drives graphs in the dashboard has been simplified to make it easier for users. Instead of using statistics collectors to add multiple sources to graphs, you can use the sampler tool to select what items you would like to gather statistics from.

In the tutorial we can start with creating the initial graph using the Sink: Unhappy Customers statistics. Once you have pinned the graph to your dashboard, it should look like the image below.

new-graph.jpg

When you click on the graph it opens the properties of the graph on the right side of the screen. The first section shows the different items that the graph is pulling statistics from. Currently the unhappy customers sink is the only object being used.

graph-properties.jpg

To add the happy customers sink to this graph you can use the sampler icon and then click on the sink in your process flow. This will add the sink to the items being sampled for your graph. Your graph properties should look like the image below.

graph-properties-both-sinks.jpg

At this point if you run your model the graph should populate with data from your sinks and look like the graph below.

graph-stair-step.png

You can change the name of the graph and how the graph is drawn in the properties tab.

To create the histogram of the staytime of tokens in the Acquire: Get service step in the process flow, click in the dashboard so that the dashboard library is open. Select the stay time graph and click the little tab to open more options for the type of graph. Select the histogram option and click in your dashboard to add a histogram to your dashboard. dashboard-library.jpg

staytime-histogram.jpg

Now to add data to your histogram you follow the same steps as adding the happy customers sink to the earlier graph. Select the sampler and then click on Acquire: Get service in your process flow. This will collect the staytime data for each token that enters that activity and create a graph that will look similar to the one below.

staytime-histogram.png

If you would like to look at the stats collectors that gather the data for the graphs in FlexSim you can click on any graphs and in the properties tab open the advanced section and click install. This will allow you to look at the stats collectors in the toolbox tab.

I also suggest using the statistics collector tutorials to learn more about how the statistics collectors work.

https://docs.flexsim.com/en/22.1/Tutorials/AdditionalTools/Tutorial2StatsCollector/StatsCollectorOverview/StatsCollectorOverview.html

I hope this answers your question.


5 |100000

Up to 12 attachments (including images) can be used with a maximum of 23.8 MiB each and 47.7 MiB total.

Write an Answer

Hint: Notify or tag a user in this post by typing @username.

Up to 12 attachments (including images) can be used with a maximum of 23.8 MiB each and 47.7 MiB total.