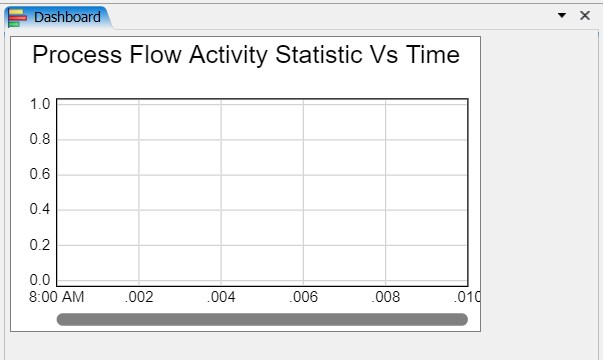
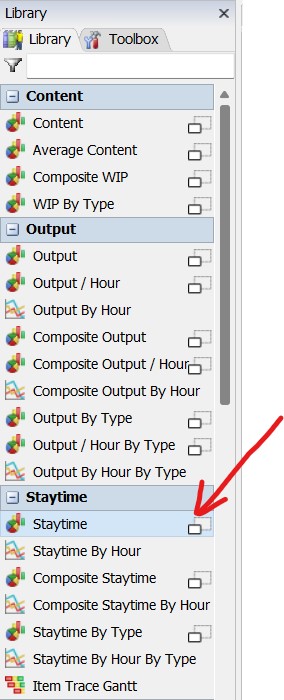
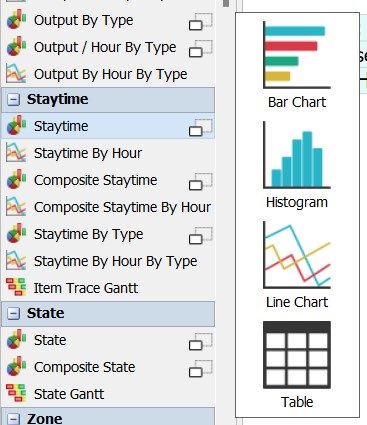
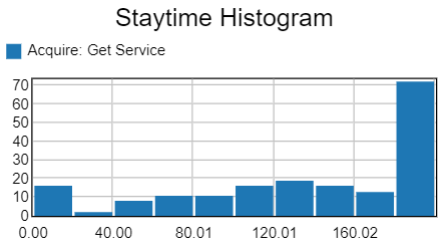
In this step, as well as with steps in tutorial 1.2, I ran into some issues with following the guidelines of the tutorials. I realize that the new version works a little different than what is explained in the tutorial steps.
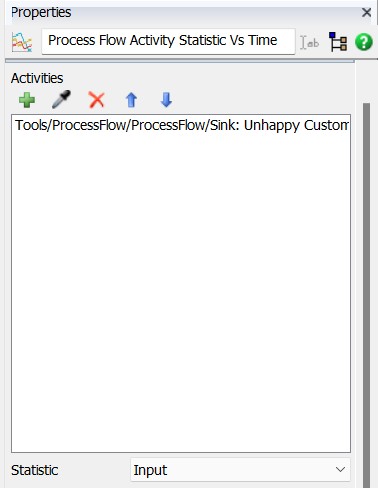
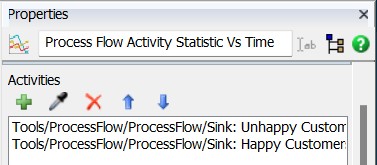
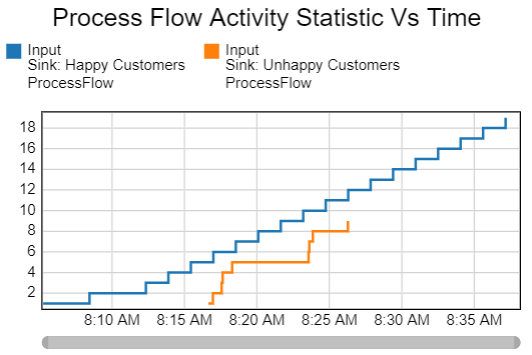
The main issue with this difference for me is how the statistics collector works. I read in previous comments that I need to 'install' this manually now to get the statistics collector in my toolbox when I pin a chart to the dashboard. However, when I have to change things in the properties window, as in step 5 of tutorial 1.3, the settings I find are also completely different (and also look more complicated than the tutorials). The same counts for property settings of the charts themselves, where some options in the 'Data' tab seem to be absent. Since I think that getting the graphs on my dashboard right and understanding how the statistics collector works, I really want to understand how to complete these basic tutorials with the new version. Could i get guidelines for step 5 of tutorial 1.3 for the new version?

