question

Sung K2 avatar image
0 Likes"
Sung K2 asked Sung K2 edited

Flow unit traveling is not visible on Mass Flow Conveyor

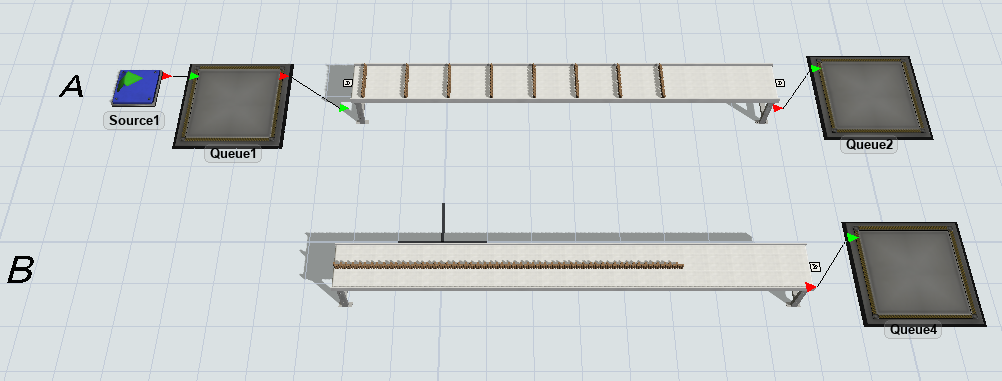
As you see in the picture of example model, Flow A doesn't show the flow unit traveling when the flow units are generated by flow item through Mass Flow Entry Transfer.
It happens when the Units per Item set to "not enough or less than" Units per Item to be accumulated on the conveyor (width).

Flow B has continuous generating flow unit with same rate as Flow A, and it shows the flow unit traveling.

I understand that Flow A is kind of "Cluster of flow unit" arrival (Generated by FlowItem inter-arrivals), meanwhile Flow B is "Continuous" flow unit arrival. But at least Flow A should show similar to B or inter-arrival clustered flow on the MFC.

I am afraid if I missed any?? Is there any workaround to show the traveling for Flow A?

massconvclusterarrive.fsm


1652273549496.png1652276454661.png


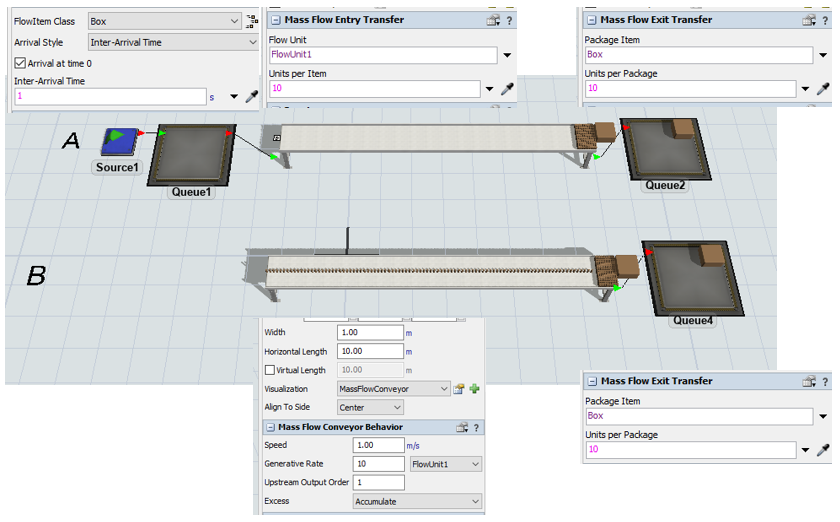
FYI, when the units per item is set to 24 (enough units to make to fill the conveyor width), it shows what I expected.

1652276959791.png

FlexSim 22.1.1
massflowconveyorflowunitflowunit rate
1652273549496.png (177.1 KiB)
1652276454661.png (12.6 KiB)
1652276959791.png (107.3 KiB)
5 |100000

Up to 12 attachments (including images) can be used with a maximum of 23.8 MiB each and 47.7 MiB total.

1 Answer

·
Phil BoBo avatar image
1 Like"
Phil BoBo answered Sung K2 edited

The mass flow conveyor deals in densities and changes in density.

You can see the actual representation of its change points by checking the Show Mass Flow Rate Change Points box in the Conveyor System Properties.

In your top conveyor, the distance between the density change points is smaller than the size of the flow unit you are trying to draw the shape of. Since there is no room, that draw mode isn't drawing anything.

1652280367232.png

If you use the Level Bars draw mode, then you can see what is happening a little better. As you know, the top conveyor has short, repeated intervals of dense mass and no mass, and the bottom conveyor has one long interval of sparse mass.

1652280400240.png

The bottom conveyor also has a lot fewer events involved in its calculations because it only has 1 change point. The top conveyor has many change points and is losing its benefit as a mass-flow conveyor because you are creating events for every flowitem because of how far apart they are.

The simulation is working fine statistically in both cases. Your issue is just with the draw mode of how the density is rendered in the 3D view. So the "answer" to your question will really depend on what you are actually trying to accomplish in your actual model instead of this sample model that was purposefully constructed to determine how the Shapes draw mode works when you have really close change points.


1652280367232.png (1.4 MiB)
1652280400240.png (573.0 KiB)
· 1
5 |100000

Up to 12 attachments (including images) can be used with a maximum of 23.8 MiB each and 47.7 MiB total.

Sung K2 avatar image Sung K2 commented ·

Thanks much, BoBo.

Yes, I figured that the statistics are fine, and I just wanted to have reasonable visual flow for the A line case. I didn't notice we have the "Showing Mass Flow Change Points" option. It seems sufficient to represent / explain the flow for my model. Thanks a lot again for your kind explanation!
- Sung

0 Likes 0 ·

Write an Answer

Hint: Notify or tag a user in this post by typing @username.

Up to 12 attachments (including images) can be used with a maximum of 23.8 MiB each and 47.7 MiB total.