question

Kj311 avatar image
0 Likes"
Kj311 asked Kj311 commented

Statistics Collector - not working as stated in the manual

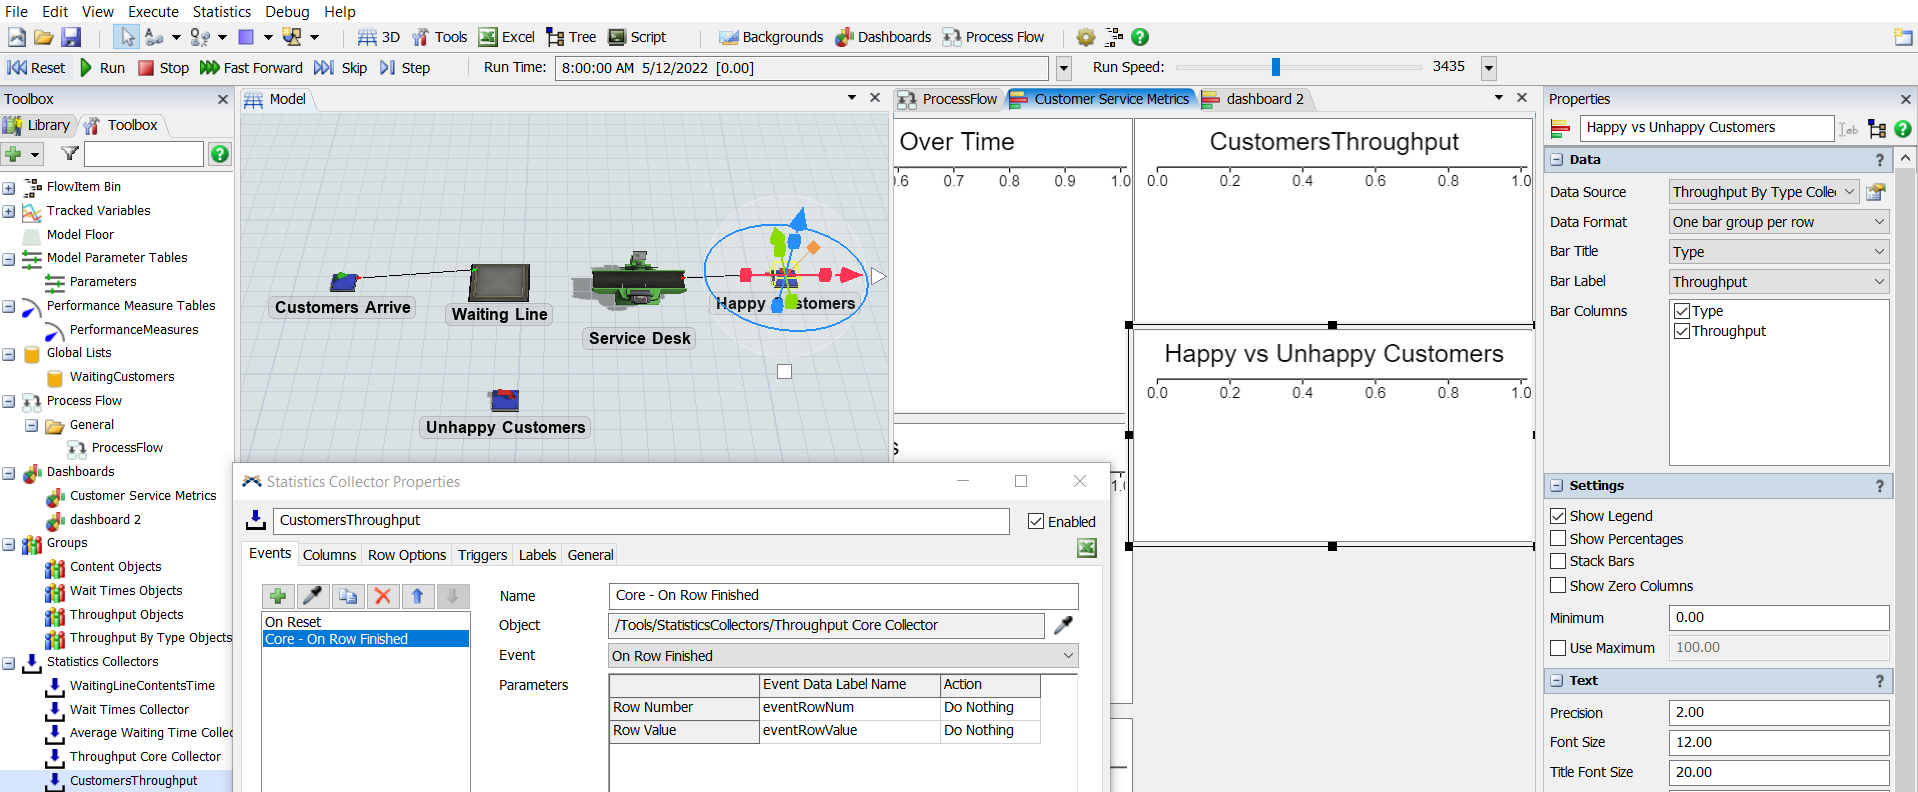
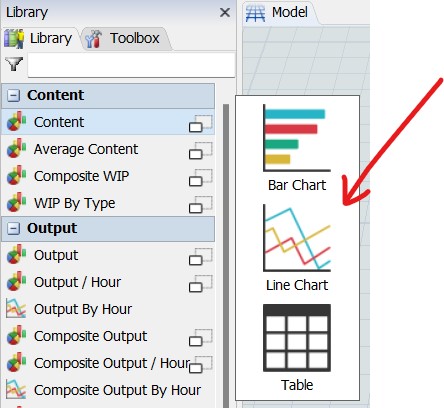
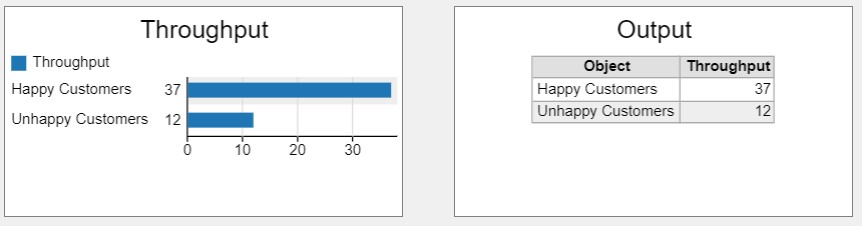
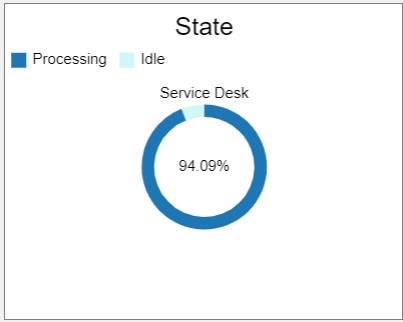
TASK 1.2 - GET DATA FROM THE 3D MODEL.fsmFor the throughput's stats collector I'm not seeing the EnumeratedObjects in the events tab. Also, because the stats collector doesn't appear automatically (contrary to what it says in the manual) I've had to install that for each chart. But, I'm still not seeing "Include" where I could check off Average in the Data tab. Also, please confirm that in the Data Source menu (in the Data tab) I should be selecting the respective Stats Collector. If so, this differs from what's said in the instructions. Basics Tutorial Task 1.2 - Get Data from the 3D Model (flexsim.com)

The Model is Attached - Could anyone please help and send me the corrected one, please.

Thank you!

1652366823575.png


FlexSim 22.0.0
dashboardsstatistics collectorstatisticsenumerate
5 |100000

Up to 12 attachments (including images) can be used with a maximum of 23.8 MiB each and 47.7 MiB total.

1 Answer

·
Jacob W2 avatar image
0 Likes"
Jacob W2 answered Kj311 commented

Hi @Kj311,

I am going to go through the steps to add the graphs to the dashboard from basic tutorial 1.2 starting with step 2.

Once you have created a dashboard as shown in step 1, there are two ways that you can accomplish step 2. The first way is by using the pins in the statistics section of your "waiting line" queue. This creates a content vs time graph. You can change the name in the properties tab on the right side of the screen. The second way is by going to the dashboard library and selecting a line chart from the expanded options for the content graphs

line-chart.jpg

When you run your model you should get a graph that looks like the one below.

content-vs-time.jpg

Now we can move to step 3.

To create the desired wait time graphs you can either use the pin button on the "Waiting Line" queue, or drag out staytime graphs from the library. Either way, you will need to select a bar graph and a table. If you pull the graphs from the library you will just need to make sure to select the waiting line queue with your sampler. With the table that you create, you can remove the minimum staytime and column headers in the properties section as shown below.

table-properties-tab.jpg

Once you have added the graph and table and edited them as you want, you can run the model. The graphs should look similar to the ones shown below.

wait-time-graphs.jpg

Now we can move to step 4.

Statistics collectors are the most difficult parts of stats collection in FlexSim, and because of that I am not going to explain how to use them. However, I have included a link to the stats collector tutorials that explain them in more depth. Instead I am going to go over how to make the throughput charts created in step 4.

https://docs.flexsim.com/en/22.0/Tutorials/AdditionalTools/Tutorial2StatsCollector/StatsCollectorOverview/StatsCollectorOverview.html

To create the throughput graphs, all you need to do is add an output bar graph and an output table to your dashboard. Once they are placed you can use the sampler tool to select both your happy and unhappy customers sinks. Once you run your model the graphs should look similar to the ones below.

throughput-graphs.jpg

In Step 5 you will make a state chart. This shows the different states that a fixed resource or task executor is in during a model run. To create one you can once again either use the pin button in the statistics section for the resource you want to graph, or drag a state chart from the dashboard library and then select what resource you want to sample. You can then run your model and watch the graph update. It should look similar to the one below.

state-chart.jpg

Hopefully this helps walk you through how to create the different graphs in Basics Tutorial Task 1.2


· 1
5 |100000

Up to 12 attachments (including images) can be used with a maximum of 23.8 MiB each and 47.7 MiB total.

Kj311 avatar image Kj311 commented ·
thank you, Jacob!
0 Likes 0 ·

Write an Answer

Hint: Notify or tag a user in this post by typing @username.

Up to 12 attachments (including images) can be used with a maximum of 23.8 MiB each and 47.7 MiB total.