question

Clair A avatar image
0 Likes"
Clair A asked Joshua S edited

How to display partition content with a process flow activity statistics chart ?

Since FlexSim 22.0, a new Process Flow Activity Statistics chart template has been added in the dashboard library.

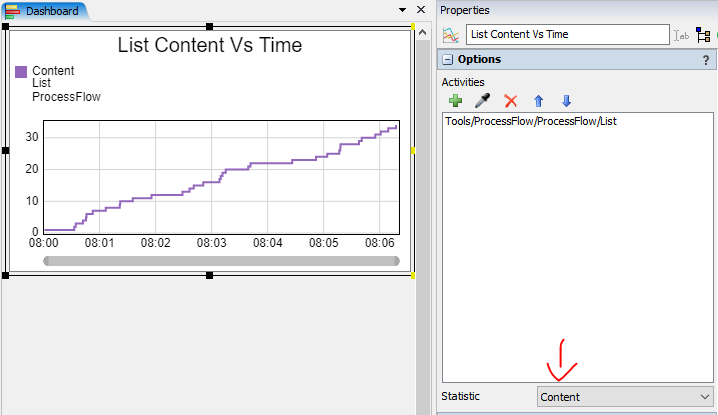
With this new template, you can easily display a list content vs time:

1657188756365.png

But if you select Partition Content in the Statistic picklist, the chart stays empty:

1657188874220.png

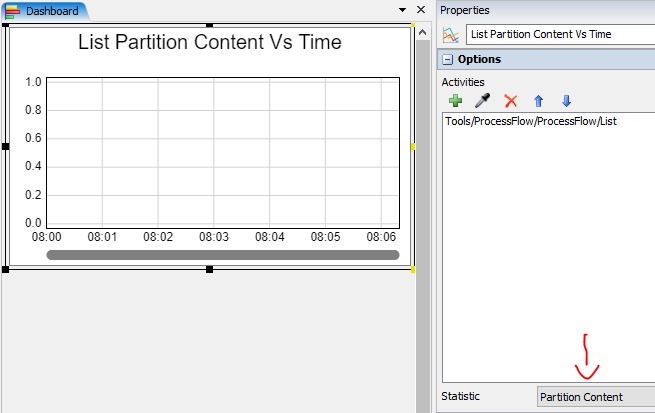
Is this new chart template not designed to work with list partition statistics ?

With the process flow legacy charts, it was easy to display a list partition content vs time, and we were able to specify which partitions we wanted to show in the chart:

1657189017154.png

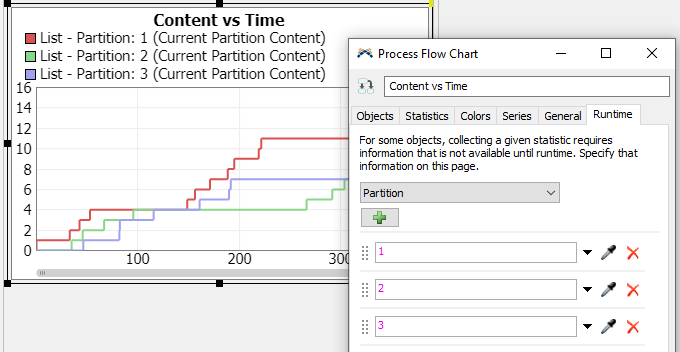
See attached model Partition content vs time.fsm for example.

@Jordan Johnson

FlexSim 22.1.2
partition contentlist statistic
5 |100000

Up to 12 attachments (including images) can be used with a maximum of 23.8 MiB each and 47.7 MiB total.

1 Answer

·
Joshua S avatar image
0 Likes"
Joshua S answered Joshua S edited

The new chart does not work with list partitions, seems to have provided more options to select than it should have. It will be fixed for the next bugfix.

5 |100000

Up to 12 attachments (including images) can be used with a maximum of 23.8 MiB each and 47.7 MiB total.

Write an Answer

Hint: Notify or tag a user in this post by typing @username.

Up to 12 attachments (including images) can be used with a maximum of 23.8 MiB each and 47.7 MiB total.