can i get the instant acceleration of an AGV to make a dashboard time graph?
Need to see the instant total electric consumption of the AGVs vs time and that will do.
can i get the instant acceleration of an AGV to make a dashboard time graph?
Need to see the instant total electric consumption of the AGVs vs time and that will do.
Hi @Boris M6, was one of Felix Möhlmann's or Kavika F's answers helpful? If so, please click the "Accept" button at the bottom of the one that best answers your question. Or if you still have questions, add a comment and we'll continue the conversation.
If we haven't heard back from you within 3 business days we'll auto-accept an answer, but you can always unaccept and comment back to reopen your question.
You can try to read the values from the kinematics that the AGV Navigator creates for the Task Executers. These are generally updated on each "On Travel Start" and "On Pre Arrival" event. If you are using accumulation behaviours, "On Accumulation Stop" and "On Accumulation Resume" would also be needed.
You can access the kinematics node as a property of the AGV class (AGV(object).kinematics) and read the needed values with the getkinematics() command.
The tricky part is to differentiate between new and old kinematics on each update and stop outdated kinematic information from being written to the gathered statistics.
In the attached model I listen to the events mentioned above with an Event Triggered Source in a Process Flow. For each kinematic that has not started yet (starttime not in the past), I create a child token with information for that kinematic.
The parent token then waits for the next event. It then checks the start time of the first kinematic of the new token and aborts all of its child token with larger end time values from writing to the Tracked Variable labels that are used to collect the statistics.
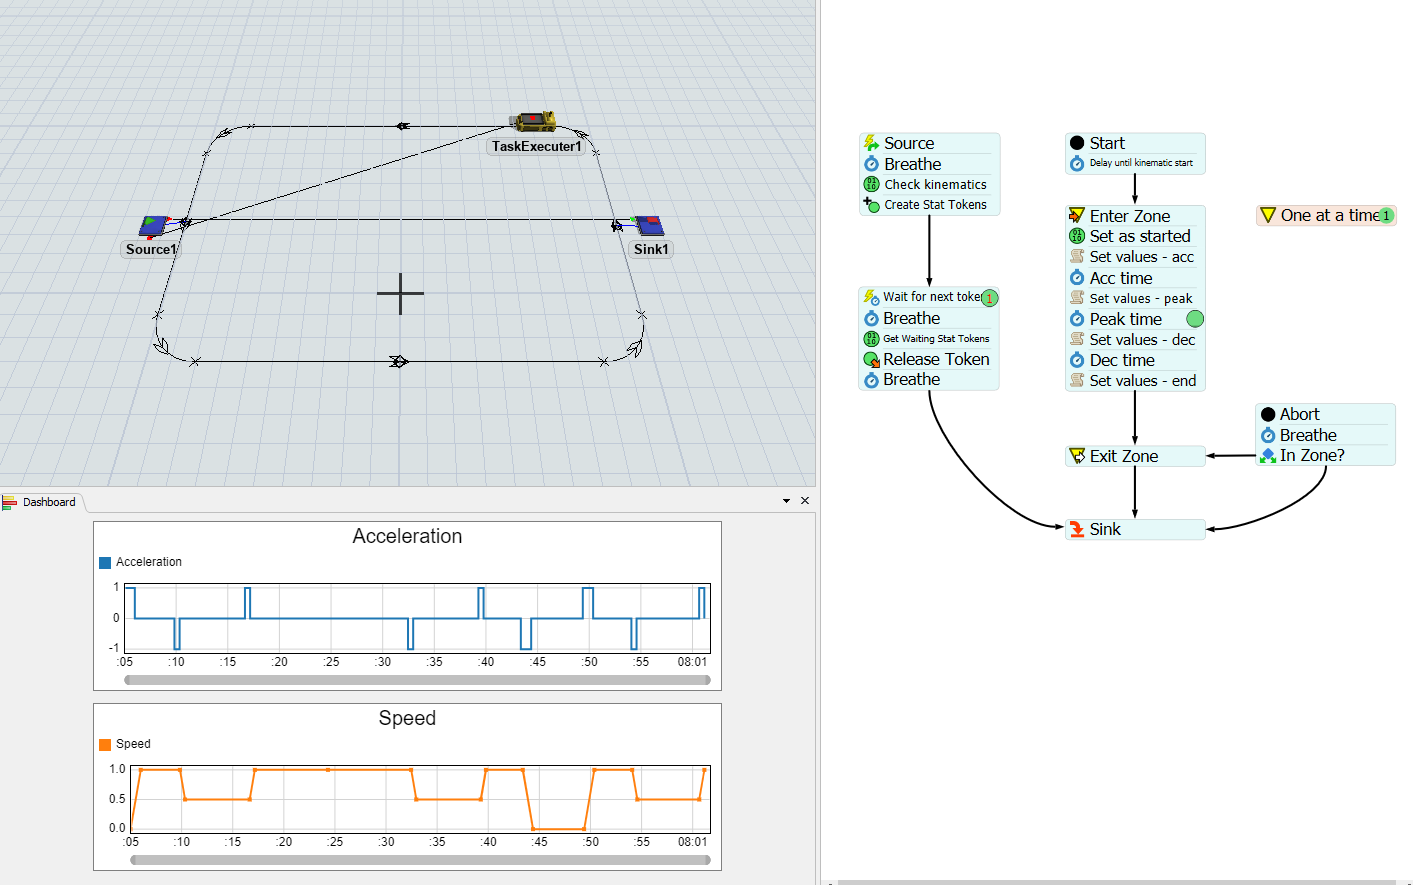
In more complex networks, there are probably cases where this logic brakes, so it might require some refining. But I hope this can serve as a starting point.
Hey @Boris M6, this might be a solution to your problem. You can create a Statistics Collector to track the battery level of AGVs as they travel along the network. You can then plot their battery levels in a graph. This is what mine looks like. I changed the AGV speeds and battery usages so we could get some bigger differences on the graph. I have the stats collector gathering data on battery usage every 1 model second.
Here's my model for reference: test agv acceleration.fsm
19 People are following this question.
FlexSim can help you understand and improve any system or process. Transform your existing data into accurate predictions.
FlexSim is a fully 3D simulation software environment. FlexSim can be used to simulate any process in any industry.
FlexSim®, FlexSim Healthcare™, Problem Solved.®, the FlexSim logo, the FlexSim X-mark, and the FlexSim Healthcare logo with stylized Caduceus mark are trademarks of FlexSim Software Products, Inc. All rights reserved.