question

Ashwath M avatar image
0 Likes"
Ashwath M asked Ashwath M commented

Average Input for every hour of the day

Hi,

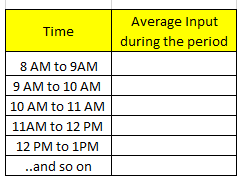
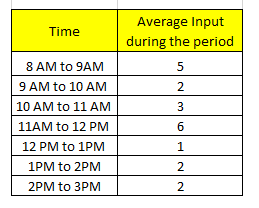
I'm looking to get the average input for every hour of the day. A statistic collector would be ideal for this, having a table with each row having the duration of that day and a second column that computes the average input during that specific hour of that day (Example like below). Any thoughts on how this can be executed when the model is run for longer periods of time? Appreciate the inputs!1668707862215.png

FlexSim 22.0.6
statistics collectortimeaverage content
1668707862215.png (3.9 KiB)
5 |100000

Up to 12 attachments (including images) can be used with a maximum of 23.8 MiB each and 47.7 MiB total.

1 Answer

·
Jeanette F avatar image
0 Likes"
Jeanette F answered Ashwath M commented

Hello @Ashwath M,

Pull an output by hour chart from the library into the dashboard. Select the chart and in the properties window go to the last tab called advanced and select the install button.

1668716997638.png

A window will appear like the one below. Select OK.

1668717005859.png

Two statistics collectors will show up in the toolbox. Open the statistics collector called by hour collector (not the core collector). In the first tab called Events there is a list of Events. Select the one called "Core- On Row FInished". Next to the object field is a dropper icon. Select the dropper and select the core collector and the event On Row Added. You can rename the collectors and their events so they match with input instead of output.

1668717649566.png

Your chart should then run and show the input by hour.

1668720116791.png

Input by hour.fsm


1668717005859.png (11.6 KiB)
1668717649566.png (53.6 KiB)
1668720116791.png (8.3 KiB)
input-by-hour.fsm (38.3 KiB)
· 3
5 |100000

Up to 12 attachments (including images) can be used with a maximum of 23.8 MiB each and 47.7 MiB total.

Ashwath M avatar image Ashwath M commented ·

Hi @Jeanette F Thank you for the inputs. What i am looking for is the Input with respect to each hour of a day. If I run a simulation for 30 days, I'm looking to get the average input for different time intervals within a day (9Am to 10AM, 3PM to 4PM, etc. ); I'm trying to analyze the input at different 1 hour time intervals. Do you know how this can be done? Something like the below (This should be the average for a model run of 30 days+) ; Essentially the Statistics Collector would need to have 24 rows (Each row having one hour time interval) and a column that keeps updating the average input for that specific hour interval. Thank you!1668719480795.png

0 Likes 0 ·
1668719480795.png (4.4 KiB)
Jeanette F avatar image Jeanette F ♦♦ Ashwath M commented ·

Hello @Jeanette F,

I changed the Time column in the statistics collector so it displays the time of day.

I added a calculated table that looks at the statistics collector and partitions by the time of day and averages the input.

1668720960349.png

Input by hour_1.fsm

0 Likes 0 ·
1668720960349.png (89.5 KiB)
input-by-hour-1.fsm (39.9 KiB)
Ashwath M avatar image Ashwath M Jeanette F ♦♦ commented ·
Thanks @Jeanette F that worked. Appreciate the inputs
0 Likes 0 ·

Write an Answer

Hint: Notify or tag a user in this post by typing @username.

Up to 12 attachments (including images) can be used with a maximum of 23.8 MiB each and 47.7 MiB total.