Hello,
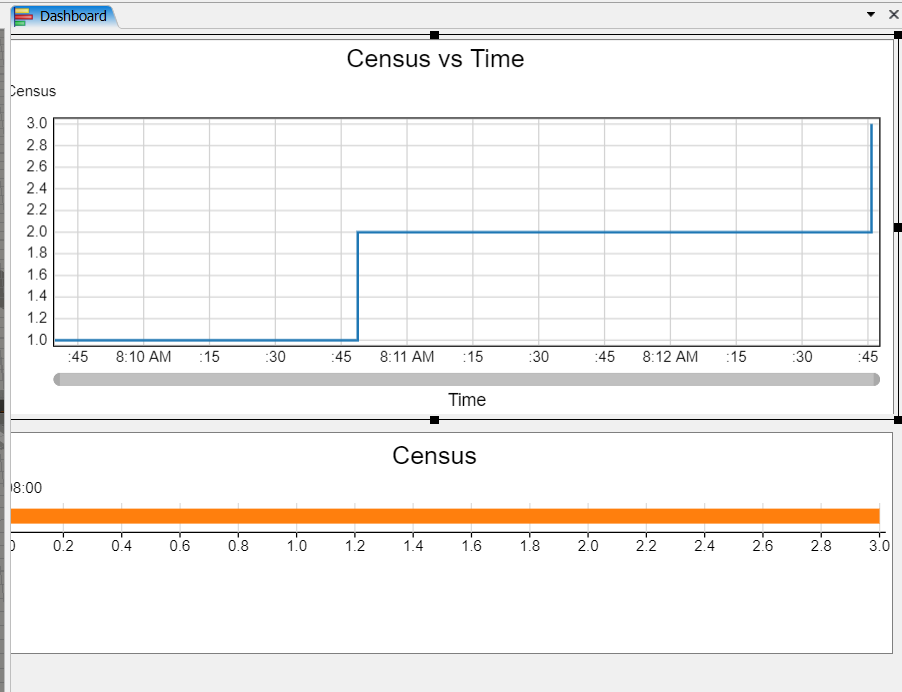
I see the numbers/census in the two types of census charts, meaning line and bar charts do not match. Any explanation why that might happen?
I attached a simple model here, so you can see.
Thanks
Hello,
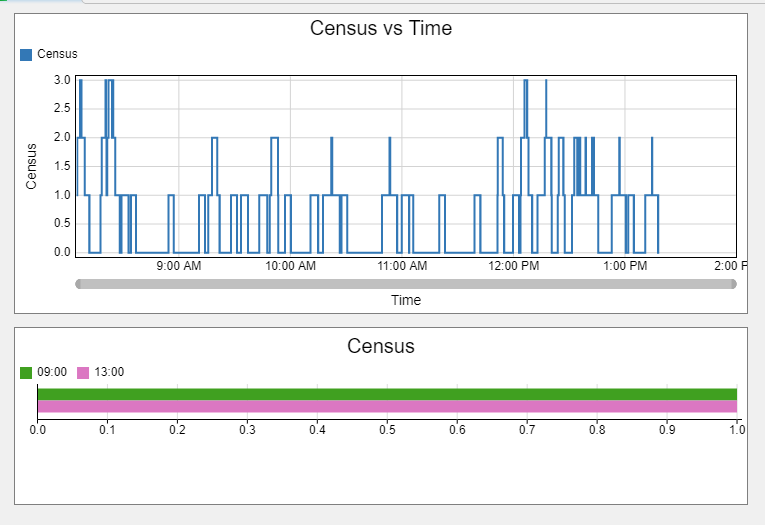
I see the numbers/census in the two types of census charts, meaning line and bar charts do not match. Any explanation why that might happen?
I attached a simple model here, so you can see.
Thanks
Hello @Maryam H2,
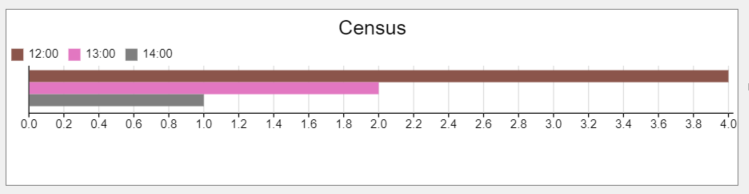
So if you partition by hour then you will get the absolution number of patients at the end of the hour in the bar chart. If you change the time chart to have the partition then you will see more clearly where those numbers are coming from.
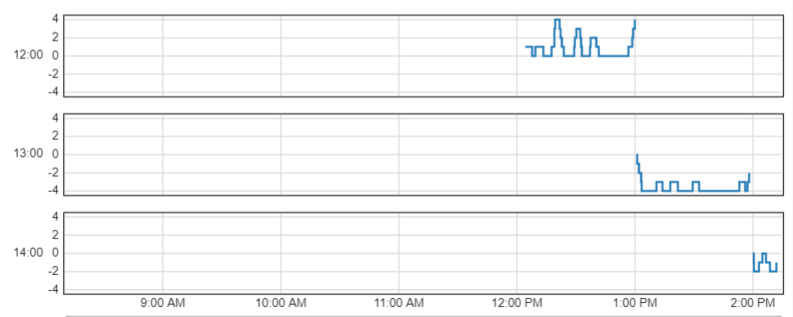
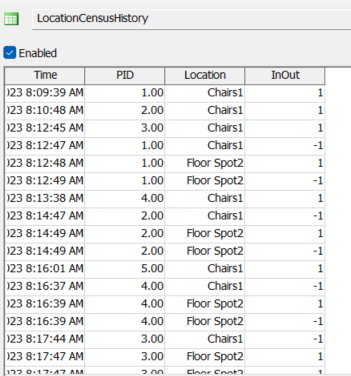
Notice how the number goes negative in 13:00 because the patients who arrived during 12:00 leave. If you opening the location census history will also then help you see the coming and going of patients in the locations.
13 People are following this question.
FlexSim can help you understand and improve any system or process. Transform your existing data into accurate predictions.
FlexSim is a fully 3D simulation software environment. FlexSim can be used to simulate any process in any industry.
FlexSim®, FlexSim Healthcare™, Problem Solved.®, the FlexSim logo, the FlexSim X-mark, and the FlexSim Healthcare logo with stylized Caduceus mark are trademarks of FlexSim Software Products, Inc. All rights reserved.
May we collect and use your data?
Learn more about the Third Party Services we use and our Privacy Statement.May we collect and use your data to tailor your experience?
Explore the benefits of a customized experience by managing your privacy settings for this site or visit our Privacy Statement to learn more about your options.