I have AGVs moving on and then passing from a control point. I created a stat collector which creates timestamp as soon as AVG arrives along with row number.
I want to make a plot which provides average per hour arrivals on that control point. How can I go about doing that?
Stat Collector to plot graph on control point allocation
FlexSim 21.0.10
Hey @Jay K9, here's an example you could try implementing: cp-stats-collection.fsm
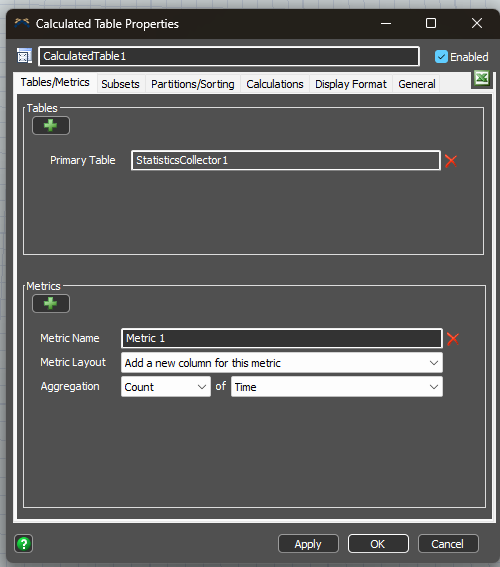
I made a Stats Collector that records the AGV and the Time it arrived at a CP (just the hour). Then I made a Calculated Table that counts the number of entries in the "Time" column.
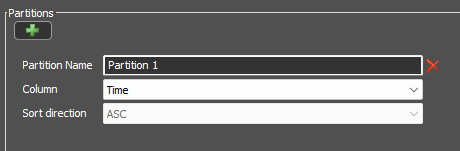
 I added a Partition that adds a different row for each different value in the Time column (a new row for each hour).
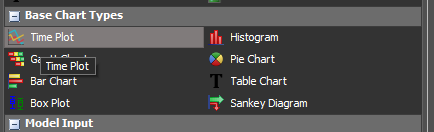
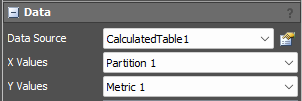
Then I made generic Time Plot in the Dashboard that uses the Calculated Table as its source.
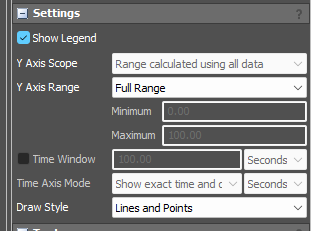
I made sure under the "Settings" panel in the properties of the table to change the Draw Style to use lines and points.
So it should look like this at it runs (I ran it fast so you can see the changing lines and values; x-axis is time starting at 8am, y-axis is the count. You can add headers for the axis in the properties).
17 People are following this question.
