I have a global table that takes some data from sql server that brings me all the data but I would like to make a graph where I can see the performance of the morning, afternoon and night shifts. Is it possible in the charts to create a filter by date?
create a column indicating the shift
FlexSim 21.2.4
What data exactly do you want to plot in a chart: The data from your global table, the state/utilization of objects, a throughput value, ...?
In general, if you have time stamps, you can use the datetime class to create a column that denotes the shift the data point belongs to by using simple conditions like "DateTime(...).hour >= 8 && DateTime(...).hour < 16".
Once you have such a column you can partition the data by it, either in a calculated table if you need to filter/aggregate the other data first, or directly through the properties of certain chart types.
Hello @Felix Möhlmann
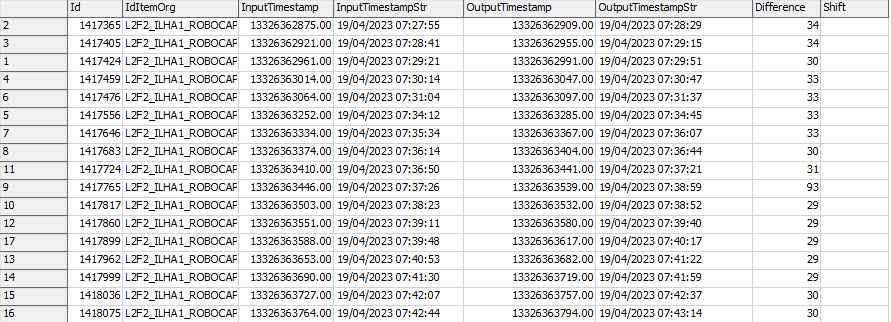
I think I didn't explain well what I want, I'm looking to make a bar chart where I can show the average cycle time per shift. I had an idea but I don't know if it's the best option, which is to create an extra column in my global table and identify which shift my cycle time is in. example if it is between 05:00 to 12:00 = T1 if it is from 12:01 to 22:00 = T2 and until 22:01 to 05:00 = T3. Is it possible to do that? Is it the most viable option ?

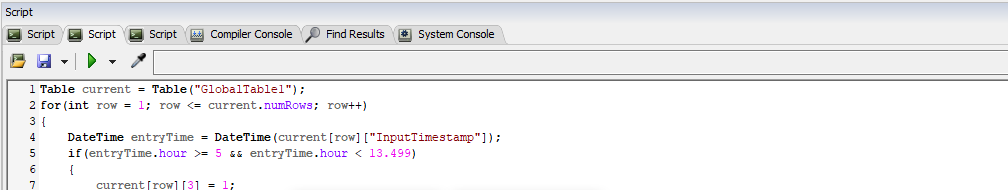
That is pretty much what I tried to describe in my comment. The code to determine would look something like this (missing the reference to the table that you would have to provide).
- Table current = Table("GlobalTable1");
- for(int row = 1; row <= current.numRows; row++)
- {
- DateTime entryTime = DateTime(current[row]["InputTimestamp"]);
- if(entryTime.hour >= 5 && entryTime.hour < 12)
- {
- current[row][3] = 1;
- continue;
- }
- if(entryTime.hour >= 12 && entryTime.hour < 22)
- {
- current[row][3] = 2;
- continue;
- }
- current[row][3] = 3;
- }
This code loops through the entire table. If you add the entries one by one you can of course directly compute the shift for just that row.
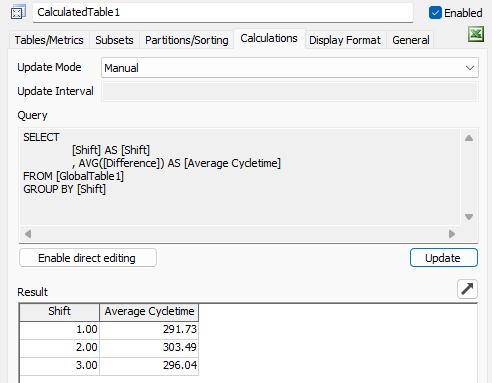
To then get the average into a bar chart you can use a calculated table to get the average value of the Difference column partitioned by the shift.
Either use the options on the first and third tab to generate the query or enable the direct editing to type it in manually.
in the code above it changes the value of my inputTimestap, how do I change the shift column. Another thing I will share the model, would you show me this calculated field better?
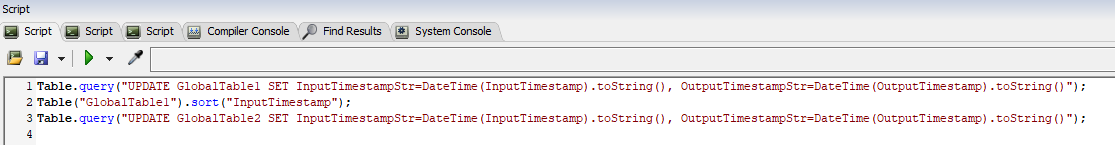
You can use this to set your shift number if shifts 1,2 and 3 correspond to 0-8hrs, 8-16hrs, 16-24hrs:
- Table.query("UPDATE GlobalTable1 SET Shift = 1+(DateTime(InputTimestamp).hour>=8)+(DateTime(InputTimestamp).hour>=16)");
In my example model the Shift column was the third one in the table. You have the change the column number/name when assigning the shift values to reflect your table format.
15 People are following this question.
