question

Ankur A3 avatar image
0 Likes"
Ankur A3 asked Felix Möhlmann commented

Assigning percentages as labels in bar chart?

Hi Team,

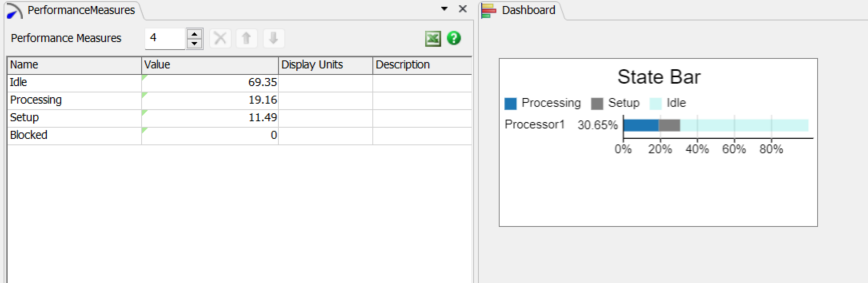
When we see time in state statistics in bar chart, it is shown as below:

1689924676648.png

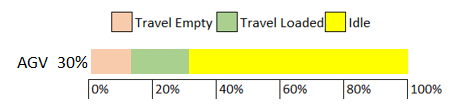
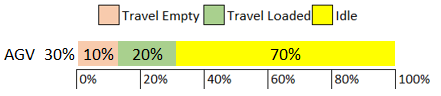
It is little difficult here to find the exact percentage split. Instead, is there any way to assign the % labels over the bar to find the exact values as below:

1689924808581.png

Thank you!

FlexSim 23.1.0
statisticsbar chart
1689924676648.png (11.5 KiB)
1689924808581.png (12.8 KiB)
5 |100000

Up to 12 attachments (including images) can be used with a maximum of 23.8 MiB each and 47.7 MiB total.

1 Answer

·
Jonah K avatar image
0 Likes"
Jonah K answered Felix Möhlmann commented

There currently isn't a way to display the percentages exactly as you have described, but there is an easy way to access those values with Performance Measures.

Add a performance measure for each state you want to keep track of, and change the "Name" cells to be the name of each state. Click the cell in the "Value" column, click the dropdown, and select the Reference sampler (eyedropper). Use it to select your object in the 3D model, hover over "State Percentage", and select the corresponding State. Do this for each of the states/performance measures. When you reset and run, you will see that the values update to be the percentages of time in which your object spends in that state, as shown here:

1689981880824.pngThis should be sufficient if you just want to see the state percentages, but it also will make it easier for you if you definitely want to incorporate these values into the dashboard --maybe using a statistics collector.

This method is demonstrated in this model:

StatePercentages.fsm


1689981880824.png (41.8 KiB)
· 2
5 |100000

Up to 12 attachments (including images) can be used with a maximum of 23.8 MiB each and 47.7 MiB total.

Ankur A3 avatar image Ankur A3 commented ·
Hi @Jonah K,


Thank you for your response!

This approach looks good in case of 1 object. But when we have multiple processors, it will be little tedious to follow it for every processor for each state.

I was looking for if we can directly show % in bar chart, it will be easy to compare as well.

If this is really not possible, what is the best possible way to do it?

Thank you!

0 Likes 0 ·
Felix Möhlmann avatar image Felix Möhlmann Ankur A3 commented ·

Maybe take a look at this recent post. It deals with adjusting tables from the people module to work in the default environment and show all state times of an object in a single row. Editing it to show the percentage instead of the total times in the state shouldn't be difficult.

0 Likes 0 ·

Write an Answer

Hint: Notify or tag a user in this post by typing @username.

Up to 12 attachments (including images) can be used with a maximum of 23.8 MiB each and 47.7 MiB total.