question

Aries Vash avatar image
0 Likes"
Aries Vash asked Aries Vash commented

Is it possible to create a custom chart in the dashboard?

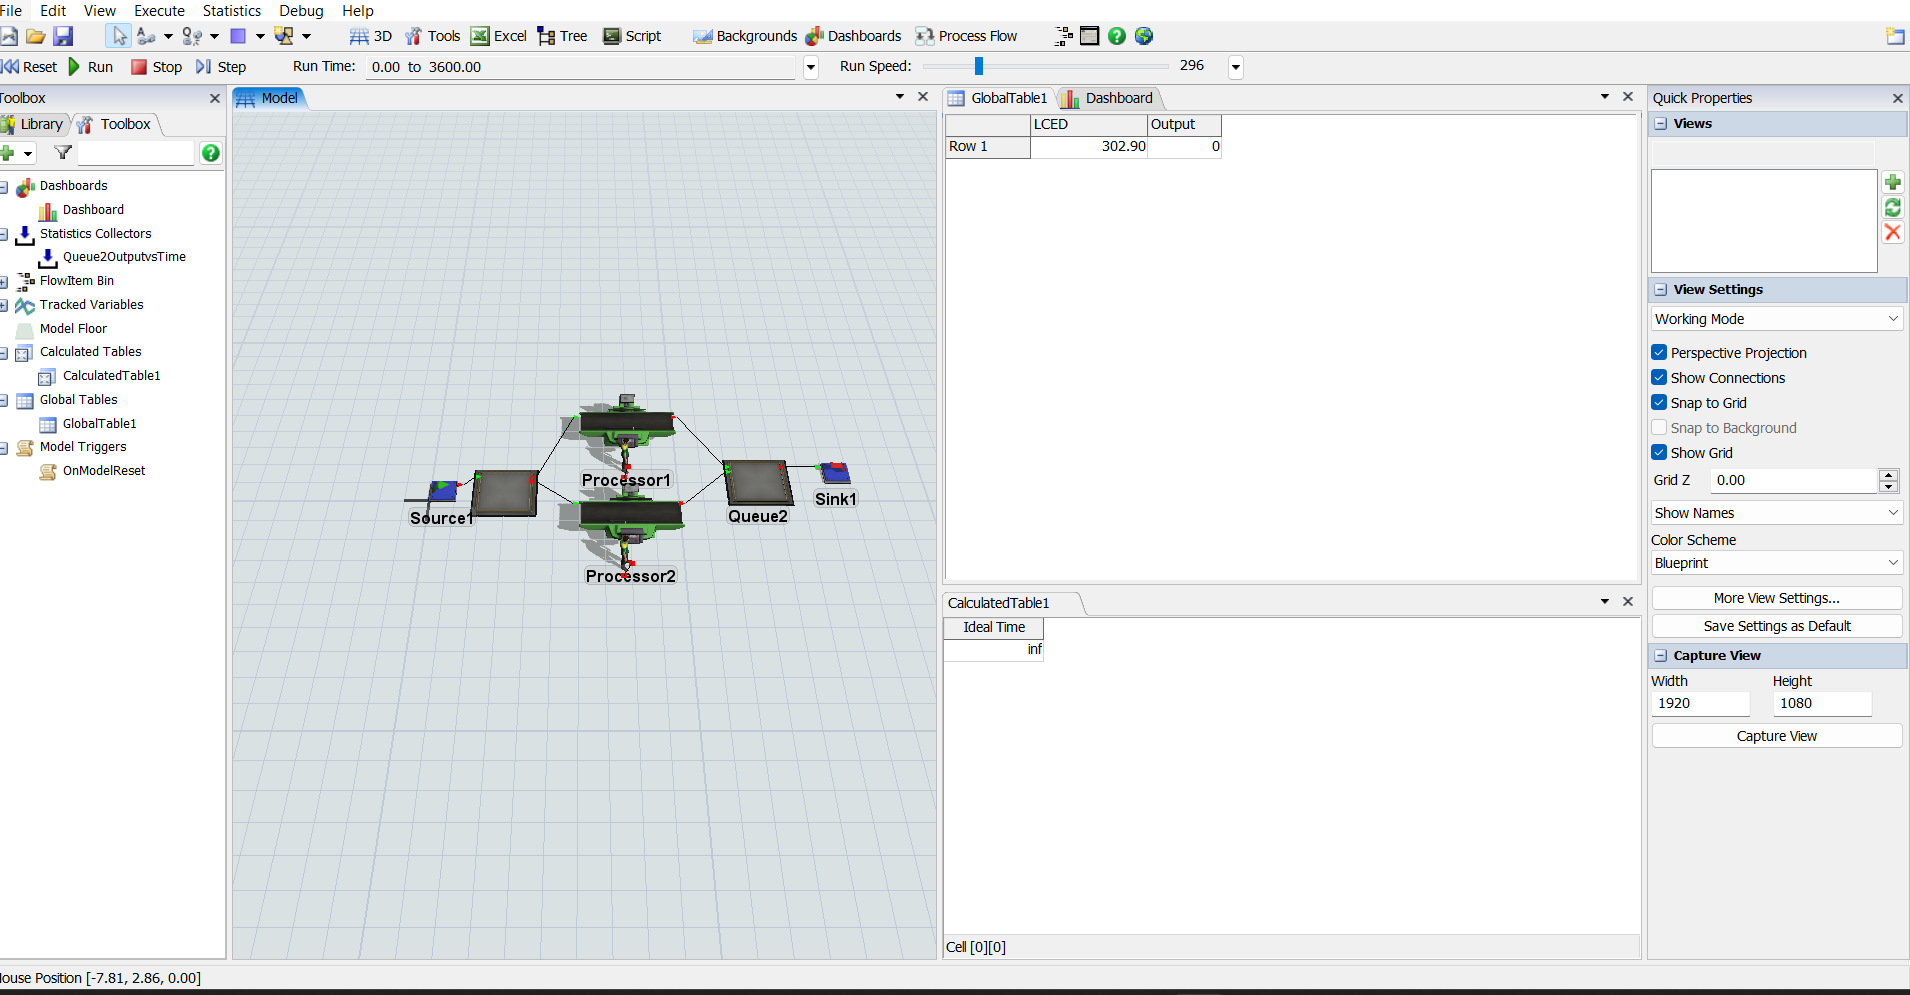
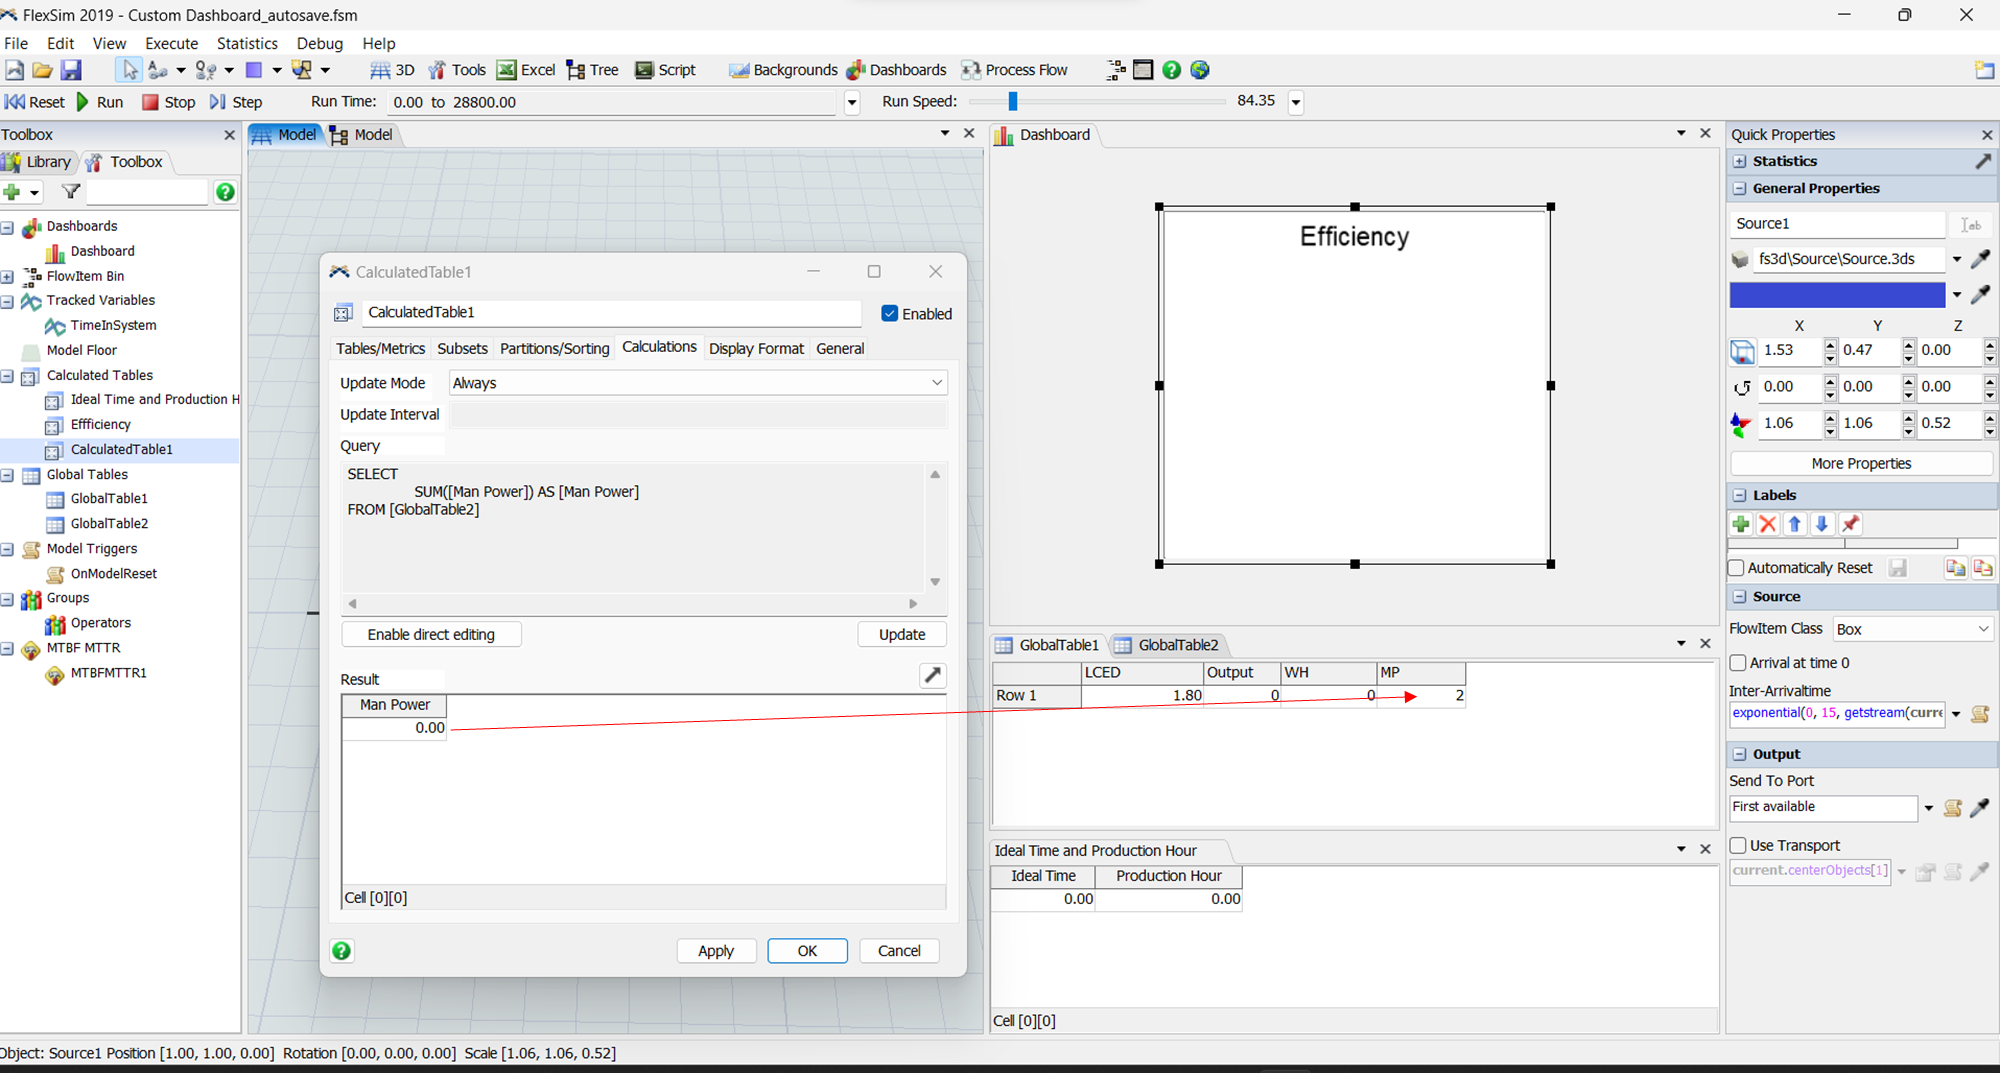
Hi, I need help on the following, is it possible to create a custom chart in the dashboard using the following formula below?

Define the variables:

  1. 1. LC (Labour count is a constant given number)
  2. 2. Standard Efficiency divider = 233
  3. 3. Actual Manpower (Number of operators in the model)
  4. 4. Production Hour (Simulation time/hour)
  5. 5. Output (where output of the end queue)


Formula:

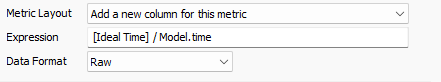
Ideal Time = LC * 233 / Output

Actual Production Hour = Actual Manpower * Production Hour


In the dashboard, calculate:

Efficiency = Ideal Time / Actual Production Hour


Example:

LC = 1.3

Standard Eff Divider = 233

Actual Manpower = 2

production hour = 1 hour

Output = 292 pieces


Ideal Time = 1.3 * 233 / 292 = 1.037

Actual Production Hour = 2 * 1 = 2


Efficiency = Ideal Time / Actual Production Hour = 1.037/2 = 0.518 or 51.8%


1690168512380.png

Custom Dashboard.fsm

FlexSim 19.2.4
dashboard display
1690168512380.png (23.7 KiB)
· 3
5 |100000

Up to 12 attachments (including images) can be used with a maximum of 23.8 MiB each and 47.7 MiB total.

Joerg Vogel avatar image Joerg Vogel commented ·

@An L2, yes, it is possible. Please do some of the tutorials about advanced techniques gathering data. If I would do this, I'd start with a standard ouput statistic collector, a calculated table and a dashboard with a pie chart.

1 Like 1 ·
Aries Vash avatar image Aries Vash Joerg Vogel commented ·

@Joerg Vogel Thanks for the tip, I have tried to study your suggestion, currently I can calculate for Ideal Time base on the formula I have given in the post, but I'm still lost on how to do this custom chart.


Custom Dashboard.fsm

1690441765813.png


0 Likes 0 ·
1690441765813.png (177.7 KiB)
Julie Weller avatar image Julie Weller commented ·

Hi @Aries Vash, was the answer helpful? If so, please click the "Accept" button at the bottom of their answer. Or if you still have questions, add a comment and we'll continue the conversation.

If we haven't heard back from you within 3 business days we'll auto-accept an answer, but you can always comment back to reopen your question.

0 Likes 0 ·

1 Answer

·
Felix Möhlmann avatar image
1 Like"
Felix Möhlmann answered Aries Vash commented

It looks like all you have to do is divide that value by the current model time (in hours). You can do that directly in the Calculated Table with a custom expression metric.

1690458401872.png

Then add a base chart of your chosen type and choose the Calculated Table as data source.

Though I have some doubts whether your formula is correct. Why would the efficiency drop if the output goes up?


1690458401872.png (5.1 KiB)
· 6
5 |100000

Up to 12 attachments (including images) can be used with a maximum of 23.8 MiB each and 47.7 MiB total.

Aries Vash avatar image Aries Vash commented ·

@Felix Möhlmann Hi, you're correct about the wrong formula, my bad it should be LC/233 * Output, anyhow I have Finish building the custom chart and it works well.


Just another query for me is, is it possible to inject the result of the calculated table in to the global table?

for example is below, I have assign the operator trigger on start task to write value of 1 in the global table 2, then I Sum the value of global table 2 in the calculated table to get the total MP working in the model, Is there a way to inject the result of the sum of the operated in the calculated table to Global table 1 in MP column?

1690505993187.png

1690505880002.png


or there is any other better way to do this?

Custom Dashboard.fsm

0 Likes 0 ·
Felix Möhlmann avatar image Felix Möhlmann Aries Vash commented ·

I would update the value in GlobalTable1 in the same trigger that changes the value in GlobalTable2. Then the MP value will always be up to date as well and you can forego the Calculated Table entirely.

You can use Table.query() to run a SQL query in code.

1 Like 1 ·
Aries Vash avatar image Aries Vash Felix Möhlmann commented ·

Hi @Felix Möhlmann, I'm quite lost with your instruction and Table.query, sorry about this but I'm not really familiar with programming languages, can you help by making an example so I can better understand. Thank you.

0 Likes 0 ·
Show more comments

Write an Answer

Hint: Notify or tag a user in this post by typing @username.

Up to 12 attachments (including images) can be used with a maximum of 23.8 MiB each and 47.7 MiB total.