I have added a timetable to my model that include some scheduled downtimes. I want to either show the scheduled downtime percentage when I use a pie chart that shows state or at least show it in my Excel Export file when I export charts. Is this possible or scheduled downtimes are excluded from all the calculations?
Hi,
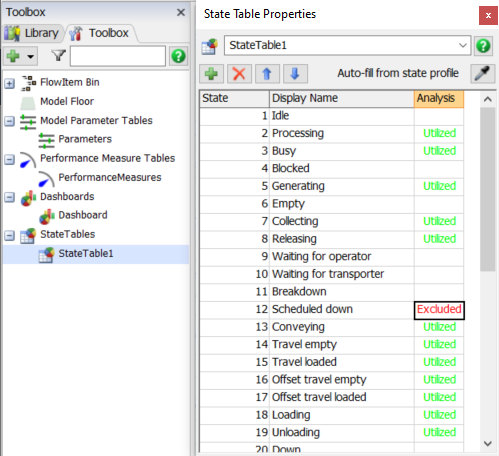
To include the scheduled down state on your state chart and overall calculations, you need to open the StateTable that the chart is associated with (found in the Toolbox menu) and change the value on "Scheduled down" from Excluded to Utilized, by clicking on its cell two times.
I hope it helps!
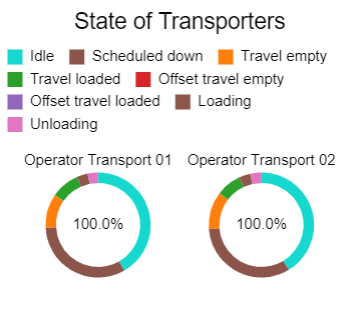
Thank you that worked! I have a different question that might be relevant to this as well. Now that I added those to my graphs the pie chart number shows as 100%. How can I customize that number to only show utilize and loading/unloading percentage?
Hello @MohammadMajd,
If you open your state table again I think you set the Idle State to Utilized in the Analysis column when it should be a blank cell.
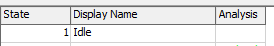
Any state with Utilized set for the analysis column will be calculated in that percent.
17 People are following this question.