question

Kevin S7 avatar image
0 Likes"
Kevin S7 asked Jason Lightfoot commented

labels in empirical distribution of global table

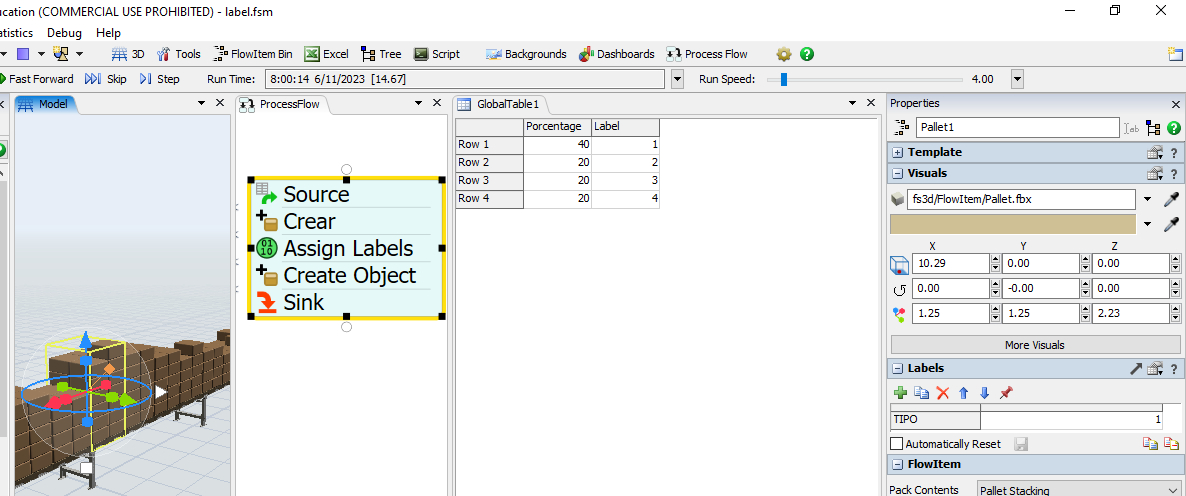
In the following global table 1 assign both the percentages and the labels that must be assigned and joins it to the process flow but does not label correctly, more labeled values are missing according to their percentage

1699416001890.png

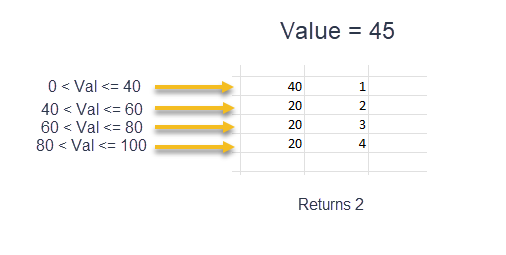
It is pure logic if 10 pallets arrive and 40% must be labeled as type 1 which represents 4 pallets and the rest must be labeled with 20% which would be only two pallets for each type and you are not doing that option because and instead of What it does is that it labels more than 40% in type 1 that should not be done as a solution and that it respects the percentage

label.fsm

FlexSim 23.2.1
labeldempirical
1699416001890.png (106.8 KiB)
label.fsm (51.5 KiB)
· 2
5 |100000

Up to 12 attachments (including images) can be used with a maximum of 23.8 MiB each and 47.7 MiB total.

Jason Lightfoot avatar image Jason Lightfoot ♦ commented ·
This post appears to be a duplicate question - which contravenes our site rules.

Also note that we try to guide students to a solution rather than doing the work for them, so please refrain from asking us provide full answers to homework/assignments - especially when adequate solutions have been described.

0 Likes 0 ·
Jason Lightfoot avatar image Jason Lightfoot ♦ commented ·

Hi @Kevin S7, was Jacob W2's answer helpful? If so, please click the "Accept" button at the bottom of their answer. Or if you still have questions, add a comment and we'll continue the conversation.

If we haven't heard back from you within 3 business days we'll auto-accept an answer, but you can always comment back to reopen your question.

0 Likes 0 ·

1 Answer

·
Jacob W2 avatar image
0 Likes"
Jacob W2 answered Jeanette F commented

Hi @Kevin S7,

The reason why the percentages are not exactly 40%, 20% and so on is because of the inherent variation within how distributions work. The empirical distribution works by using a random number stream to generate a value between 0-100. This is then compared to the percentage value in the table and if the value is within the range of the percentage it will then grab the type value in the next column. If the value isn't within the first percentage range, it then sums the first and second row, and checks again. It will repeat this over and over again until the value falls within the range of the sum of the percentages. I am including an image to help explain how this works.

empirical-distribution.png

So the reason why you are not getting exactly 4 of type 1 out of 10, is because the random value being used to find the type, is not always going to be less than 40. This is similar to flipping a coin, the probability of it being either heads or tail is 50%, however if you flip the coin 10 times, it will not always end up having 5 heads and 5 tails, it could instead be 3 heads and 7 tails. This is especially easy to notice with smaller sample sizes, the larger the sample size, the results will skew closer to a 50/50 distribution.

If you need to have exactly 4 items out of 10 be type 1, you will need to have a set pool of values that each item pulls from, and once a value is pulled it is removed from the pool. This is like having a bag of 10 numbers four 1's, two 2's, two 3's, and two 4's. Once you pull one of these, it is removed from the bag. This allows you to randomly acquire a value, but also guarantee that you will have the exact distribution that you are looking for.


· 3
5 |100000

Up to 12 attachments (including images) can be used with a maximum of 23.8 MiB each and 47.7 MiB total.

Kevin S7 avatar image Kevin S7 commented ·

@Jacob W2

My sample size is larger but perform the example in flexsim with a smaller sample to see if it works correctly since with a larger sample size like 150 units I would have to verify one by one and calculate if it meets the established percentages.


Can you help me with a model that you have or something that adapts or something that you can help me with clearer information because I am new to this but I want to get those values as close as possible or with the example of my model in flexsim to say exactly

0 Likes 0 ·
Kevin S7 avatar image Kevin S7 Kevin S7 commented ·

@Jacob W2 or how do I achieve my objective or can you guide me with a test model that you developed to understand you better one more thing the percentages I am going to increase those percentages and therefore more type labels so I need that example to guide me or a code that will take care of it of that

0 Likes 0 ·
Jeanette F avatar image Jeanette F ♦♦ Kevin S7 commented ·
Hello @Kevin S7,

You have already been shown how to accomplish this in your other post. Jacob was just reiterating what has already been said. If you are still having issues after all the help Jacob, Felix, and Jason have provided then I recommend you speak with your professor or the distributor for further help.
Also, please stop using multiple accounts to post your questions. We will answer your questions if you ask them from your original account. Please, keep in mind our best practices

0 Likes 0 ·

Write an Answer

Hint: Notify or tag a user in this post by typing @username.

Up to 12 attachments (including images) can be used with a maximum of 23.8 MiB each and 47.7 MiB total.