question

Fu P avatar image
0 Likes"
Fu P asked Jason Lightfoot commented

Show graphs in the GUI

I want to show Gantt charts, pie charts, line charts, etc. in my GUI, which I know I can do in the dashboard, but I want to show them in the GUI. I see you have a new version of the implementation, but my version is a little old, can not open your model.Can you show me some examples of this? thank you.

FlexSim 20.0.10
guichartshow chart in gui
· 1
5 |100000

Up to 12 attachments (including images) can be used with a maximum of 23.8 MiB each and 47.7 MiB total.

Jason Lightfoot avatar image Jason Lightfoot ♦ commented ·

Hi @Fu P, was Joerg Vogel's answer helpful? If so, please click the "Accept" button at the bottom of their answer. Or if you still have questions, add a comment and we'll continue the conversation.

If we haven't heard back from you within 3 business days we'll auto-accept an answer, but you can always comment back to reopen your question.

0 Likes 0 ·

1 Answer

·
Joerg Vogel avatar image
0 Likes"
Joerg Vogel answered Jason Lightfoot commented

https://answers.flexsim.com/answers/156992/view.html

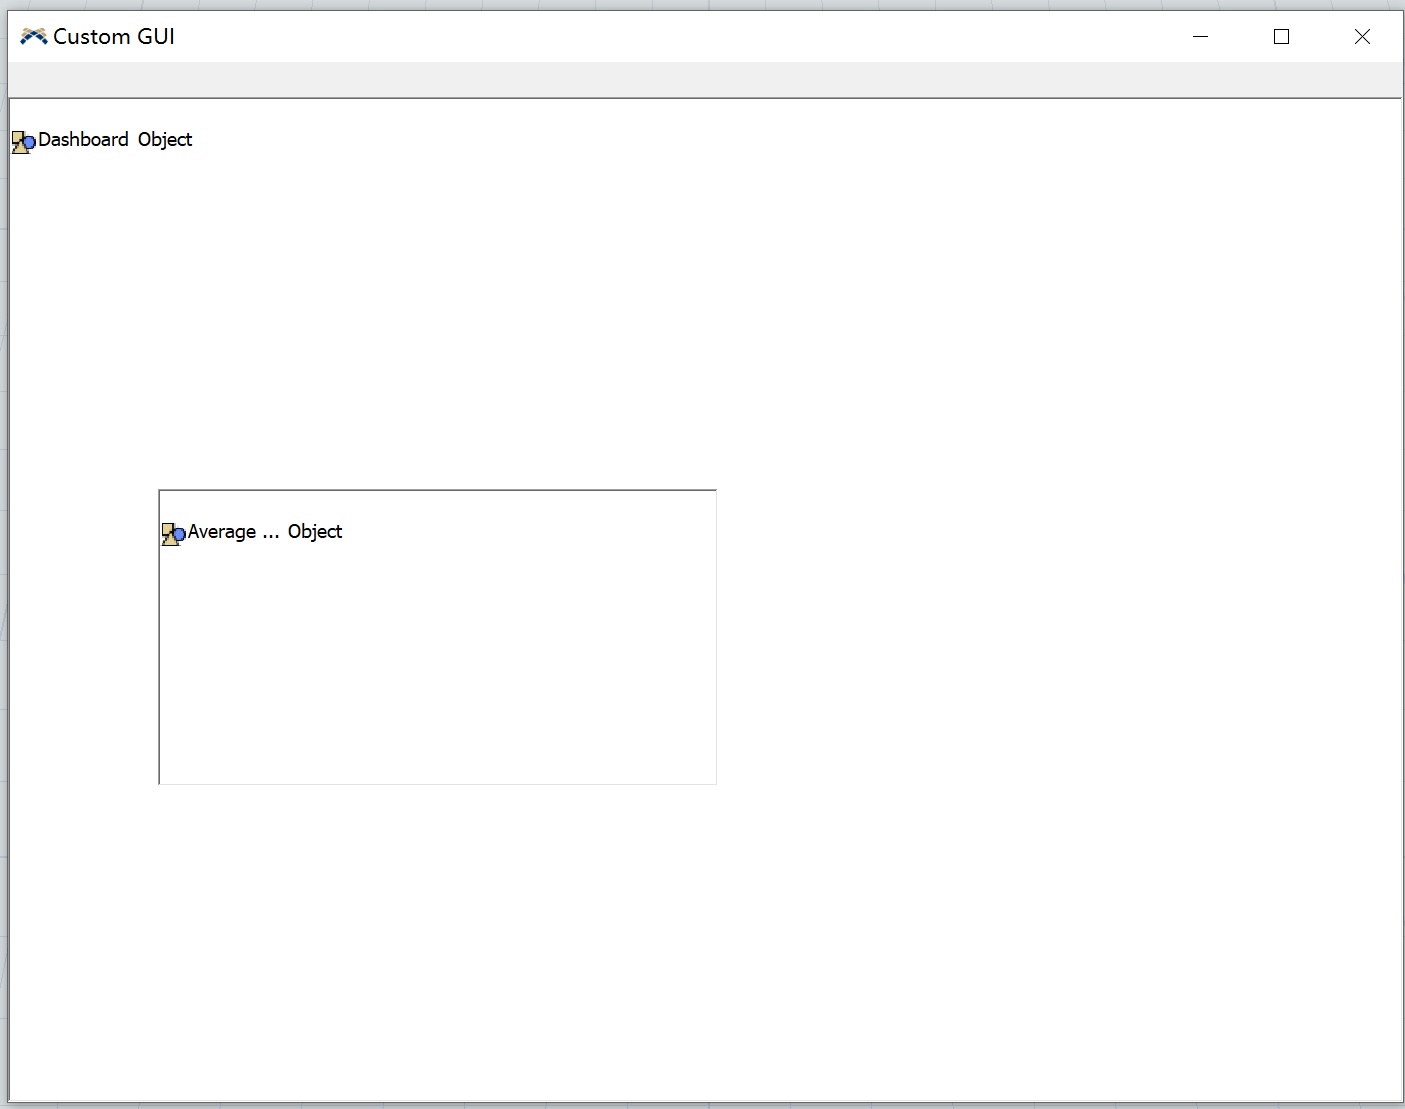
You need to add an empty node in your GUI. You must find a Dashboard node from your view tree you want to transfer into this new node. You cut it from view tree and insert it into your new GUI node.

· 2
5 |100000

Up to 12 attachments (including images) can be used with a maximum of 23.8 MiB each and 47.7 MiB total.

Fu P avatar image Fu P commented ·

I tried to do this, but only the nodes are displayed in the GUI, no graph is displayed, I wonder what went wrong.

Chart in GUI.fsmchart-in-gui.png

0 Likes 0 ·
chart-in-gui.png (19.8 KiB)
chart-in-gui.fsm (28.4 KiB)
Jason Lightfoot avatar image Jason Lightfoot ♦ Fu P commented ·
Jordan described how to do that here.
0 Likes 0 ·

Write an Answer

Hint: Notify or tag a user in this post by typing @username.

Up to 12 attachments (including images) can be used with a maximum of 23.8 MiB each and 47.7 MiB total.