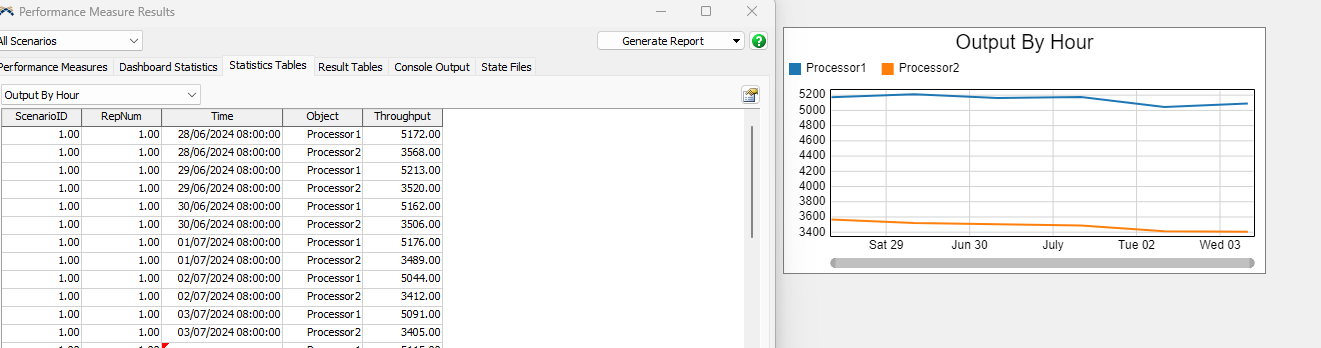
how to get a report from simulation model by periode for each replication?
for example, i run the simulation of production in some company for 1 month as 1 replication and i will get the output each month. but i want to know the output production each day in the simulation from every replication because i need this data for validate and compare with real sistem.