I have model where the complexity and time constraints don't really give me the luxury of using the experimenter. As a result, I was wondering if there was a way to run multiple replications such that the Statistics and Reports tab can collect the data?
Looking at your follow-up questions, it seems that there are two main things you want to do with the Experimenter:
- Add an operator to a specific shift in the Experimenter.
- Access data from all of your performance measures in one place.
For your first question, you can run a code in the Experimenter to join an operator to a specific time table in the model tree. It is run in the "Start of Replication" code of the "Advanced" tab in the Experimenter. This is what it would look like, only with the specific names and locations for your model:
- treenode operator = node("Operator8", model());
- treenode timetable = node("Tools/TimeTables/TimeTable1", model());
- treenode operatorTimeTableNode = nodeadddata(nodeinsertinto(getvarnode(operator,"timetables")), DATATYPE_COUPLING);
- treenode timetableMemberNode = nodeadddata(nodeinsertinto(getvarnode(timetable,"members")), DATATYPE_COUPLING);
- setname(operatorTimeTableNode, getname(timetable));
- setname(timetableMemberNode, getname(operator));
- nodejoin(operatorTimeTableNode, timetableMemberNode);
For your second question, you can access your performance measure data in the tree. Under Tools->Experimenter->Performance Measures you can select each performance measure and look at their stats.
You could do this by running the model multiple times and collecting a report for each one. In the Statistics tab you should first unselect the "Repeat Random Streams" option so that every model run is different. Then arrange your Summary Report or State Report as needed. You can then set a model trigger for "On Run Stop", which will execute the given code whenever the model is stopped. The following is the code if you are generating a summary report and below that for a state report.
Summary report:
- string directory = modeldir();
- if (stringlen(directory) < 3)
- directory = documentsdir();
- string filepath = concat(directory,"summaryreport.csv");
- fileopen(filepath);nodefunction(node("/project/exec/globals/nodefunctions/summaryreport",maintree())); // This functionality had to be C++
- fileclose();
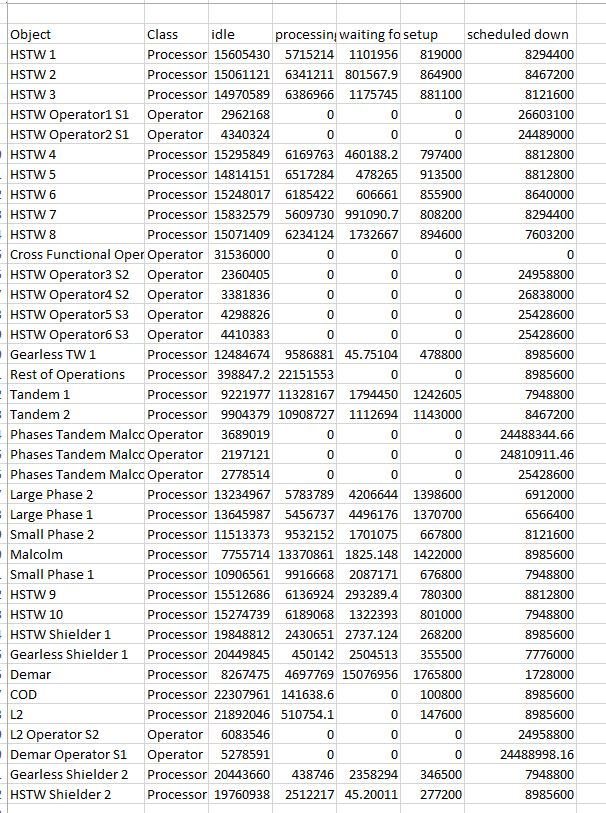
State report:
- string directory = modeldir();
- if (stringlen(directory) < 3)
- directory = documentsdir();
- string filepath = concat(directory,"statereport.csv");
- fileopen(filepath);nodefunction(node("/project/exec/globals/nodefunctions/statereport",maintree())); // This functionality had to be C++
- fileclose();
8 People are following this question.
