Hello
In the attached model, the goal is to understand the number of completed orders in a Jidoka system versus a non-Jidoka system, as well as to observe the process times of each process and the occupancy of the buffers preceding each process.
As a result of updating the statistics of the object properties, the "input vs time" option is not available, as indicated by @Jordan Johnson in: https://answers.flexsim.com/answers/144684/view.html.
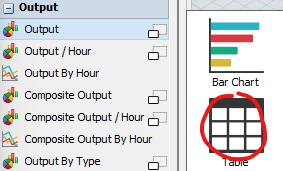
Despite obtaining a valid result using the solution from Jordan, I can only see it in table mode. The line view doesn't work for me, and this solution only allows viewing in separate tables/graphs, not unified ones.
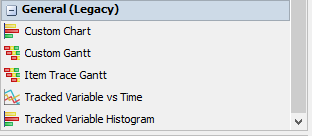
I have tried to follow the instructions from @Felix Möhlmann in: https://answers.flexsim.com/answers/117431/view.html, but I can't get the results to display as they do in the Legacy graph of the Dashboard (Legacy).
Could you help me understand what I am doing wrong? Attached is the model.
In the attached model, I have tried to create a combined line chart (from "Base Chart Types") for the two sinks. I also tested it with just one sink, but it doesn't work for me.
Additionally, in the Dashboard (Legacy), a legacy line graph can be seen for the number of completed orders in both systems. Is it possible to obtain a table with the final values at the end of the period? It can be inferred that they fall in the same values as observed in the tables of the Dashboard (current), but I wanted to know how to view the combined data of both sinks in table mode.
20240729_CP11_libro_FlexSim_Jidoka_1.fsm


