question

Borja Lorenzo avatar image
0 Likes"
Borja Lorenzo asked Felix Möhlmann answered

Creation of Colors in Graphs

Hello
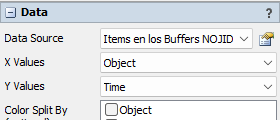
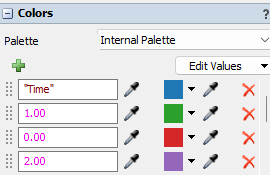
In the attached model, you can see three graphs. The first one, "Items en los Buffers NOJIDOKA_con Statistic Colector" ,shows that in the graph properties under the "Color" section, more colors have been created than intended. There should be only one color per queue.

@Felix provided an explanation here:https://answers.flexsim.com/comments/168774/view.html

I have a question about how to prevent these colors from being created in the first place. Where in the statistics collector are these colors being created? I understand that once they are created, even if you change the configuration of the collector, you will only be able to delete them as Felix mentioned in his response. I want to prevent them from being created.

Additionally, I would like to know how to prevent or why it occurs that in the graph "Items en los Buffers NOJIDOKA_con Statistic Collector," a line appears at the 0 instant when the simulation starts.

20240801_CP11_libro_FlexSim_Jidoka_4.fsm


This question is related to a previous discussion: input vs time for sink to dasboard using statics collector - FlexSim Community

FlexSim 24.1.1
statistic collectorgraphsgraph colors
5 |100000

Up to 12 attachments (including images) can be used with a maximum of 23.8 MiB each and 47.7 MiB total.

1 Answer

Felix Möhlmann avatar image
1 Like"
Felix Möhlmann answered

Colors in the chart's color palette are created whenever they are needed, meaning a value appears in the legend that has not been assigned a color yet.

When you first link a base chart to a Statistics Collector the x- and y-value columns will be chosen based on the column ordering in the Statistics Collector. The first column is assigned to the x-axis and the second column to the y-axis.

capture1.png

If you run the model with these settings, the name of the y-axis column "Time" will be used in the legend and thus a color is assigned to it.

If you check one or more columns the "Color Split By" section, the different values in that column will be used to differentiate the values in the chart. If you run the model with "Content" marked here, for example, each different value of the "Content" column will be assigned its own color.

capture2.png

A line appears at 0s because an item enters and immediately exits the respective queue, making the graph jump to 1 and back down to 0 in the same instant.


capture1.png (5.7 KiB)
capture2.png (6.2 KiB)
5 |100000

Up to 12 attachments (including images) can be used with a maximum of 23.8 MiB each and 47.7 MiB total.