question

cyc avatar image
0 Likes"
cyc asked Felix Möhlmann commented

Statistics Collector on run stop

Hello experts,

As far as I know, statistics collector don't have "on run stop" event. If I'm wrong, please feel free to correct me.

I would like to ask if there is any way to solve the following problem: when on run stop, the statistics collector updates the event value?

The reason for this is that I want to collect data from the Processor when it is in different states. (states like "waiting for operator", "blocked", I want to collect these time data to know how much time processor is in these two states individually, because statistics collector also don't have these two events.)

Thanks in advance.

FlexSim 24.1.0
statistics collectorstatesdata
5 |100000

Up to 12 attachments (including images) can be used with a maximum of 23.8 MiB each and 47.7 MiB total.

1 Answer

Felix Möhlmann avatar image
0 Likes"
Felix Möhlmann answered Felix Möhlmann commented

The Statistics Collector behind the State Chart already does this. It uses the "When the value is accessed" update timing method. The expression in the Value field is evaluated each time the table cell is read, such as when viewing a chart that uses the data. When running experiments the data will be updated automatically when the replication ends.

1726554380017.png

You can install the components of a State Chart to inspect how the collector is build. For your purposes it should be enough to uncheck the "Show Percentages" option of the State Bar Chart. It will then display the time spent in each state (that is not excluded in the State Table).

1726554327567.png


1726554327567.png (20.5 KiB)
1726554380017.png (18.8 KiB)
· 4
5 |100000

Up to 12 attachments (including images) can be used with a maximum of 23.8 MiB each and 47.7 MiB total.

cyc avatar image cyc commented ·

Dear @Felix Möhlmann,

Thank you for your help.

The State Chart does have total time for the states I would like to observe, but the data I need is that if I want to collect data from Processor when it is in blocked state, the first data I need is the timing when Processor just is in blocked state, and the second data I need is the timing when Processor just isn't in blocked state, and the third data that I want to show in statistics collector is second data minus first data, so I can get the total time when the Processor is in blocked state for this time, and the statistics collector will collect next time when the Processor is in next blocked state.

Is that possible? Because I want to collect detailed data from the processor, then I can analyze the data to rearrange the resource I have.

0 Likes 0 ·
Felix Möhlmann avatar image Felix Möhlmann cyc commented ·

That sounds like you could just use the default State Gantt chart.

1726559251801.png

0 Likes 0 ·
1726559251801.png (15.7 KiB)
cyc avatar image cyc Felix Möhlmann commented ·

Dear @Felix Möhlmann,

State Gantt chart does has detailed data. It give me some idea to do it.

However, I am finding it a bit challenging to fully understand the data collection method through the statistics collector from the State Gantt chart.

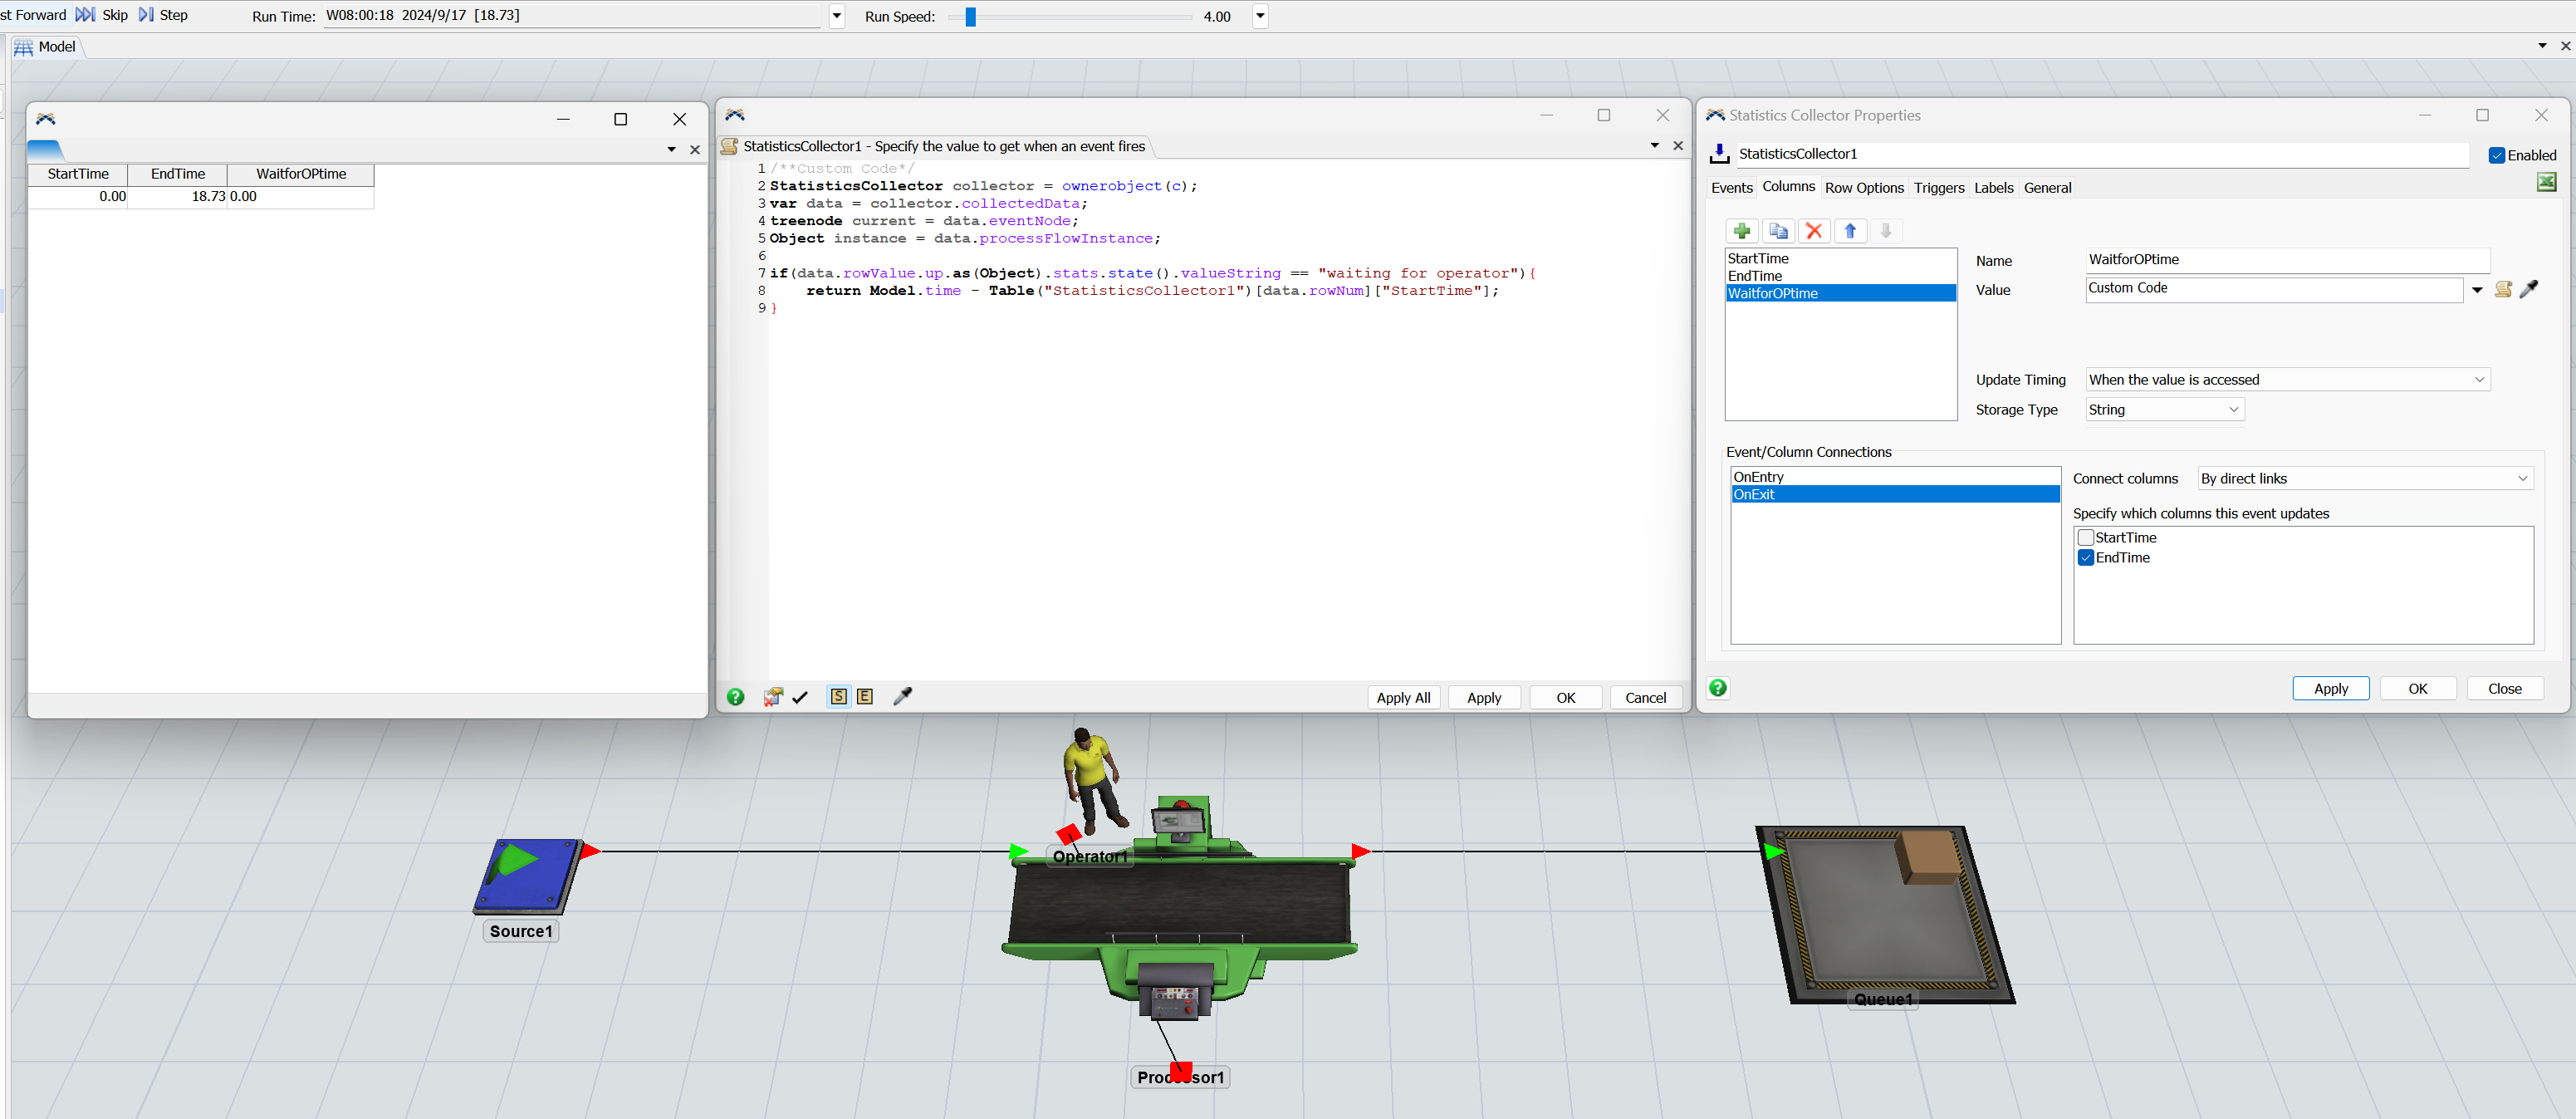
To better explain my confusion, I created a simple model, but unfortunately, my configuration does not seem to work as expected. Specifically, I am trying to collect the waiting time for an operator each time the Processor flows through an item.

Could you kindly help me understand where I might be going wrong, or suggest what I could do to resolve this issue?

Thank you in advance for your guidance.

ProblemModel.fsm

1726587889180.png


0 Likes 0 ·
problemmodel.fsm (633.6 KiB)
1726587889180.png (421.0 KiB)
Show more comments