question

Arun Kr avatar image
0 Likes"
Arun Kr asked Felix Möhlmann answered

Utilization Chart Stat Collector - Utilization Column Table Value Repeating

Hi ,

In the State Bar Collector, which is the statistics collector generated after installing the state chart, the Utilization column currently displays only a single value. Ideally, it should show the percentage value for each state.

In the modified table, I have added an extra column to display the percentage values.

I have attached an image and model for reference.

1734698230339.png

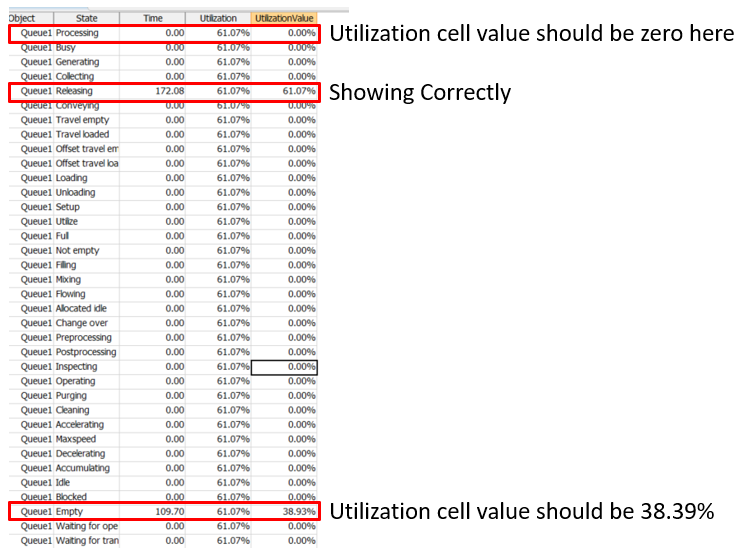
Is the repeated utilization value intentional, or could it be a mistake?

SCModel.fsm

Regards,

Arun KR

FlexSim 24.2.2
statistics collector
1734698230339.png (176.7 KiB)
scmodel.fsm (668.3 KiB)
5 |100000

Up to 12 attachments (including images) can be used with a maximum of 23.8 MiB each and 47.7 MiB total.

1 Answer

Felix Möhlmann avatar image
0 Likes"
Felix Möhlmann answered

This is intentional. The "Utilization" column is the total percentage of time spend in "active" states. The times spend in each state are stacked in the bar chart and the utilization is displayed as an aggregate value for the object in front of the bar.

The individual percentages by state are already given by the "Time" column. The bar chart converts these automatically when the "Show Percentages" option is checked. Since you have already installed the chart components you can easily test this. Deactivate that option and the bars will show the number of time units rather than the percentage.

5 |100000

Up to 12 attachments (including images) can be used with a maximum of 23.8 MiB each and 47.7 MiB total.