question

Lou Keller avatar image
0 Likes"
Lou Keller asked Matthew Gillespie commented

Box Plot Calculations

A model produced the following displays for a single, 24-hr, box plot and two, 12-hr box plots taken from the same data...

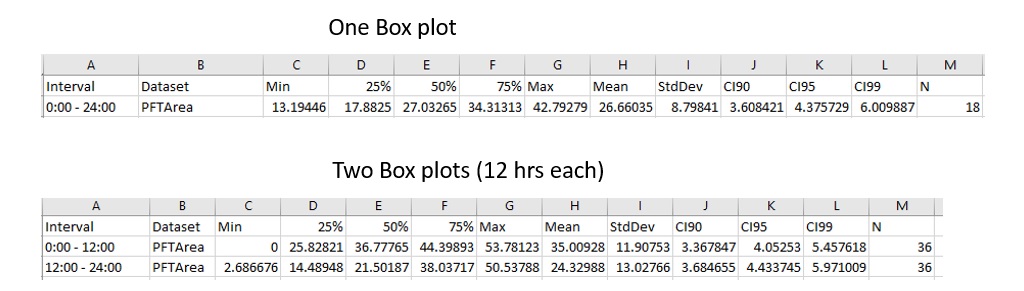
Note that the "Mean" value of the One-box plot = 26.66035, while the average of the Two-box plots = 29.669.

Questions: Why are the two means different? How are the different means calculated from existing data?

FlexSim 16.1.0
FlexSim HC 5.0.12
healthcarebox plotsmean
boxplots.jpg (79.9 KiB)
5 |100000

Up to 12 attachments (including images) can be used with a maximum of 23.8 MiB each and 47.7 MiB total.

1 Answer

Matthew Gillespie avatar image
1 Like"
Matthew Gillespie answered Matthew Gillespie commented

The average of averages rarely produces the same result as the average of the whole.

For example:

5 patients of Acuity 1 arrive in the first 12 hours Average Acuity: 1

1 patient of Acuity 5 arrives in the last 12 hours Average Acuity: 5

Average of Averages: 3

Total Average: 1.666

I'd have to look at the data to give you a more specific answer.

· 4
5 |100000

Up to 12 attachments (including images) can be used with a maximum of 23.8 MiB each and 47.7 MiB total.